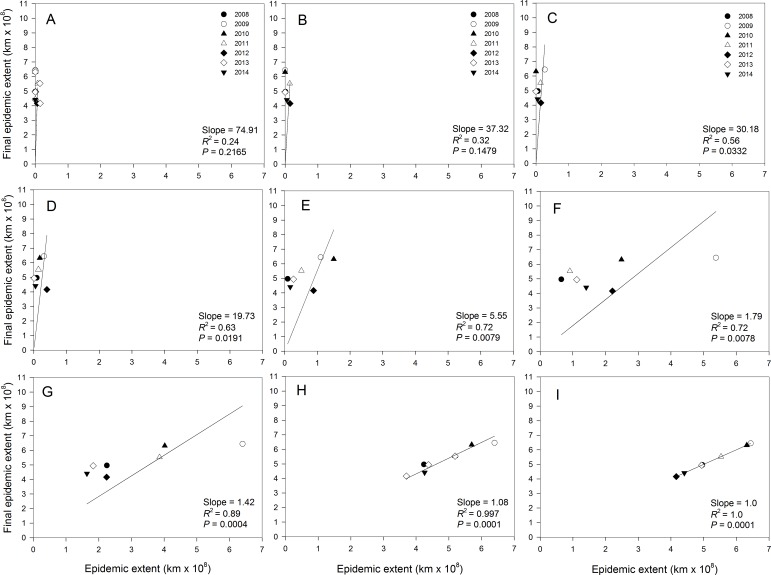
Figure 4. Relationship between final epidemic area and current epidemic area of cucurbit downy mildew.
Regression of final epidemic area on epidemicarea of cucurbit downy mildew observed in a week during the same epidemic year. (A) March 31, (B) April 14, (C) April 28, (D) May 14, (E) May 28, (F) June 11, (G) June 25, (H) July 9, and (I) July 23. Final epidemic area is epidemic extent observed on the week ending July 31 for each epidemic year. Note that the regression model is fitted without an intercept.

