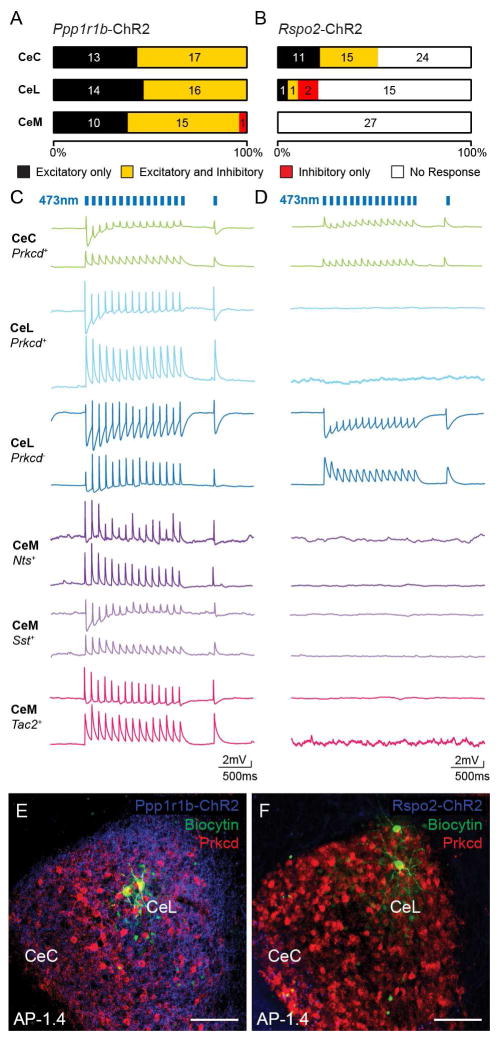
Figure 6. BLA Ppp1r1rb + and Rspo2+ neurons make monosynaptic excitatory and disynaptic inhibitory connections to distinct CeA neurons.
(A–B) The proportion and number of CeC, CeL, and CeM neurons that receive only excitatory (black), both excitatory and inhibitory (yellow), only inhibitory (red), or no response (white) from blue light stimulation of BLA Ppp1r1b-ChR2 fibers (A) or BLA Rspo2-ChR2 fibers (B). Numbers inside bars represent total number of neurons for each case.
(C–D) Example voltage clamped traces of IHC or qPCR-confirmed CeC Prkcd+, CeL Prkcd+, CeL Prkcd−, CeM Nts+, CeM Sst+, and CeM Tac2+ neurons in response to blue light stimulation of BLA Ppp1r1b-ChR2 fibers (C) or BLA Rspo2-ChR2 fibers (D). Bottom traces represent responses at ~−70 mV and top traces represent responses at ~−50 mV. Counts of genetically confirmed neurons found in Figure S6J and S6K.
(E–F) Representative histology of IHC confirmation of CeL Prkcd+ neurons in BLA Ppp1r1b-ChR2 slices (E) and CeL Prkcd− neurons in BLA Rspo2-ChR2 slices (F). The anterior-posterior (AP) distance from Bregma (mm), scale bar, 100 μm.

