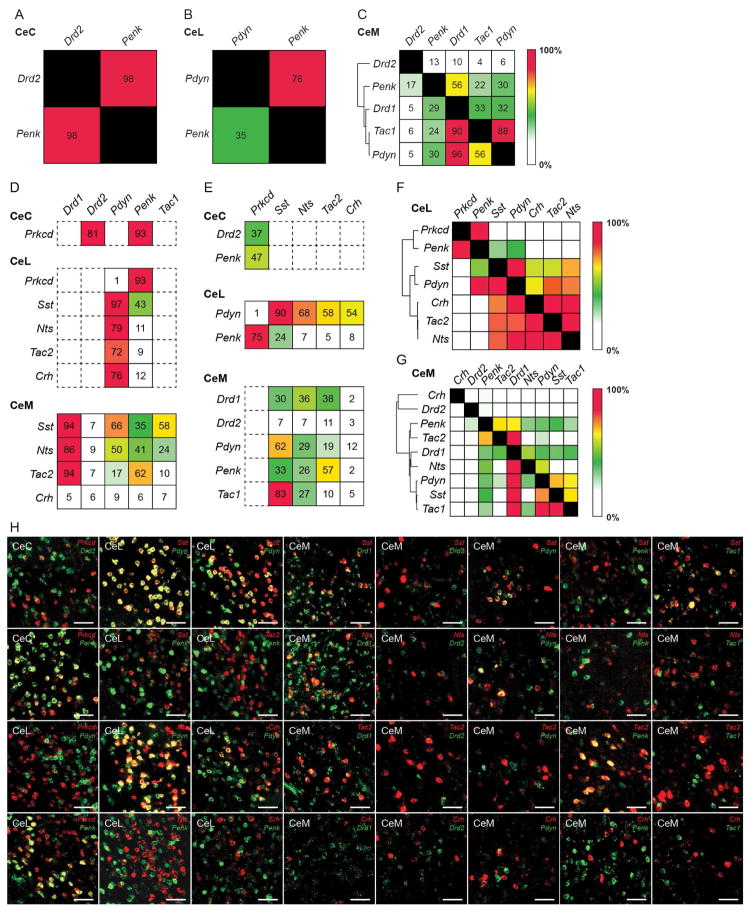
Figure 7. BLA to CeA pathway for appetitive behavior is genetically analogous to corticostriatal circuits.
(A–C) Expression of striatal genetic markers in the CeA. Quantification of overlap of Drd2 and Penk in the CeC (A). Quantification of overlap of Pdyn and Penk in the CeL (B). Quantification of overlap of Drd2, Penk, Drd1, Tac1, and Pdyn in the CeM (C). Values represent percent labelling of overlap of genes in column amongst genes in rows. For example, 35% of CeL Penk labeled neurons coexpress Pdyn (B). Values represent percentage of labeling from totaling all cells counted from n = 3 mice. Hierarchical clustering was performed in the CeM using the percent overlap profile of each gene (C).
(D–E) Quantification of overlap of striatal markers—Drd1, Drd2, Pdyn, Penk and Tac1—amongst Prkcd+ neurons in the CeC; Prkcd+, Sst+, Nts+, Tac2+, and Crh+ neurons in the CeL; Sst+, Nts+, Tac2+, and Crh+ neurons in the CeM (D). Quantification of overlap of Prkcd, Sst, Nts, Tac2, Crh amongst Drd1+ and Penk+ neurons in the CeC; Pdyn+ and Penk+ neurons in the CeL; Drd1+, Drd2+, Pdyn+, Penk+ and Tac1+ neurons in the CeM (E). Values represent percentage of labeling from totaling all cells counted from n = 3 mice.
(F–G) Overlap matrix of genes expressed in the CeL (F) and CeM (G). Values represent percentage of labeling from totaling all cells counted from n = 3 mice and include the percentage of labeling values found in Figure 1. Hierarchical clustering was performed from using the overlap profile of each gene.
(H) Representative histology of CeA expression of CeA genetic markers (Prkcd, Sst, Nts, Tac2, Crh) with striatal markers (Drd1, Drd2, Pdyn, Penk Tac1). Scale bar, 50 μm.

