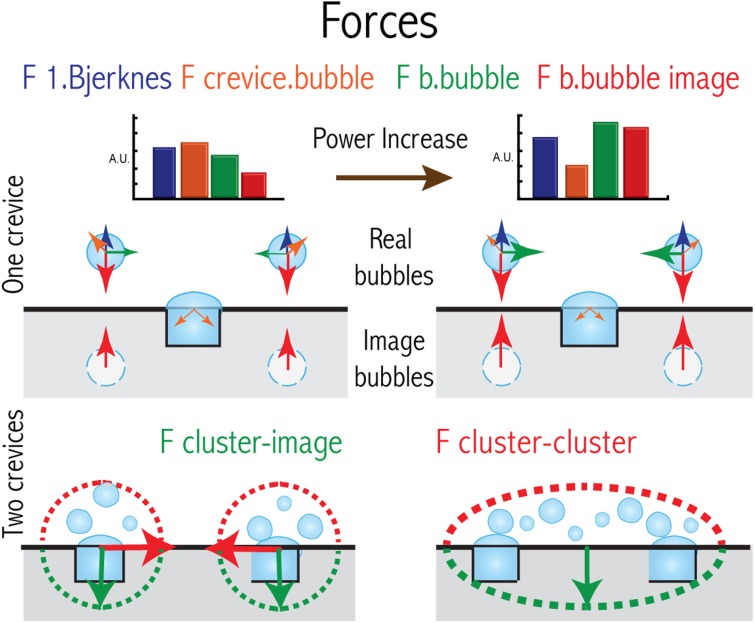
Fig. 5.
Simplified representation of forces and colors associated to them represented in arbitrary units in a bar plot for two different power settings (higher to the right). The top chart depicts the case of a single crevice and how the bubbles around it interact with each other. The bottom chart shows similar information, but when two crevices are etched and how the clusters of bubbles interact (see Fig. 6 for more details)

