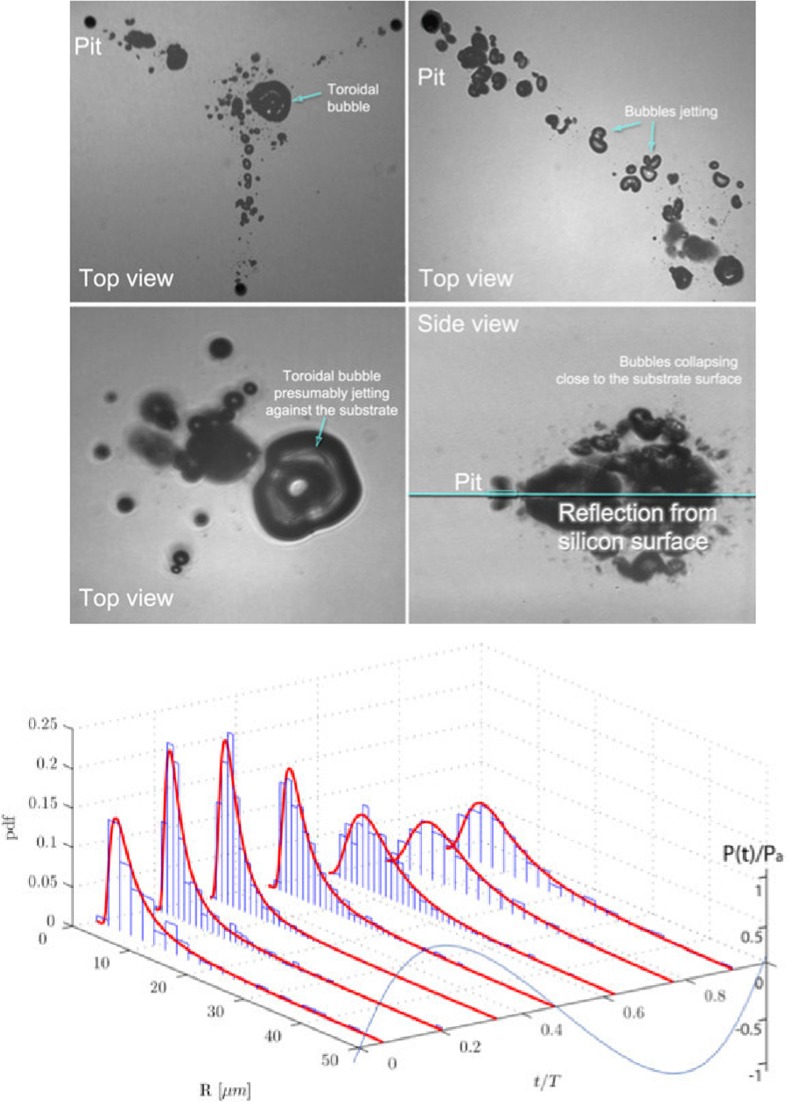
Fig. 8.
Top Short time exposure image at high power settings (0.981 W) where the deformation of bubbles and jetting phenomena is visible. Bottom Bubble size distribution histograms at a power of 0.981 W for three pits. The axis to the extreme right represents the normalized pressure for the acoustic cycle.
Reprinted from [108]. Copyright 2013, with permission from Elsevier

