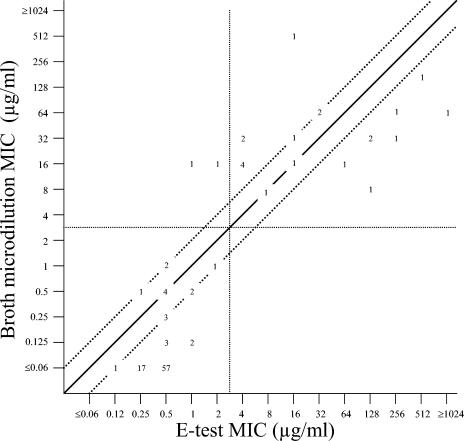
FIG. 1.
Scattergram results comparing colistin MICs determined by the E-test with those determined by the BMD reference method (n = 115). The diagonal black line represents complete agreement, and the numbers represent the occurrences observed at each point. The broken lines represent ±1-log2 MIC agreement limits between test results. Horizontal and vertical broken lines indicate the resistant MIC breakpoint (≥4 μg/ml).

