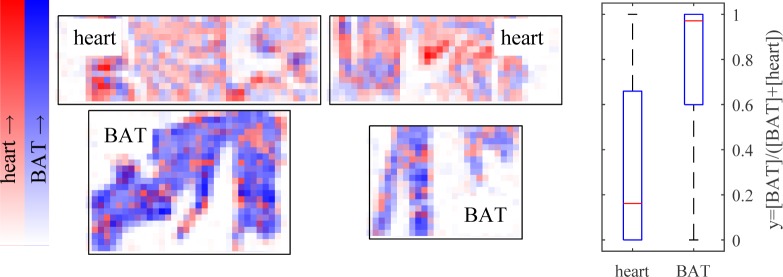
Fig. 8.
(left) Pixel-by-pixel non-negative least-squares fitting to representative response for brown adipose tissue (BAT) and heart tissue, after 9 × 9 binning. Magnitude (arbitrary scale) of fit to heart response in red, fit to BAT in blue. (right) Boxplot of normalized fit coefficients by tissue type. p = 5 × 10−61.

