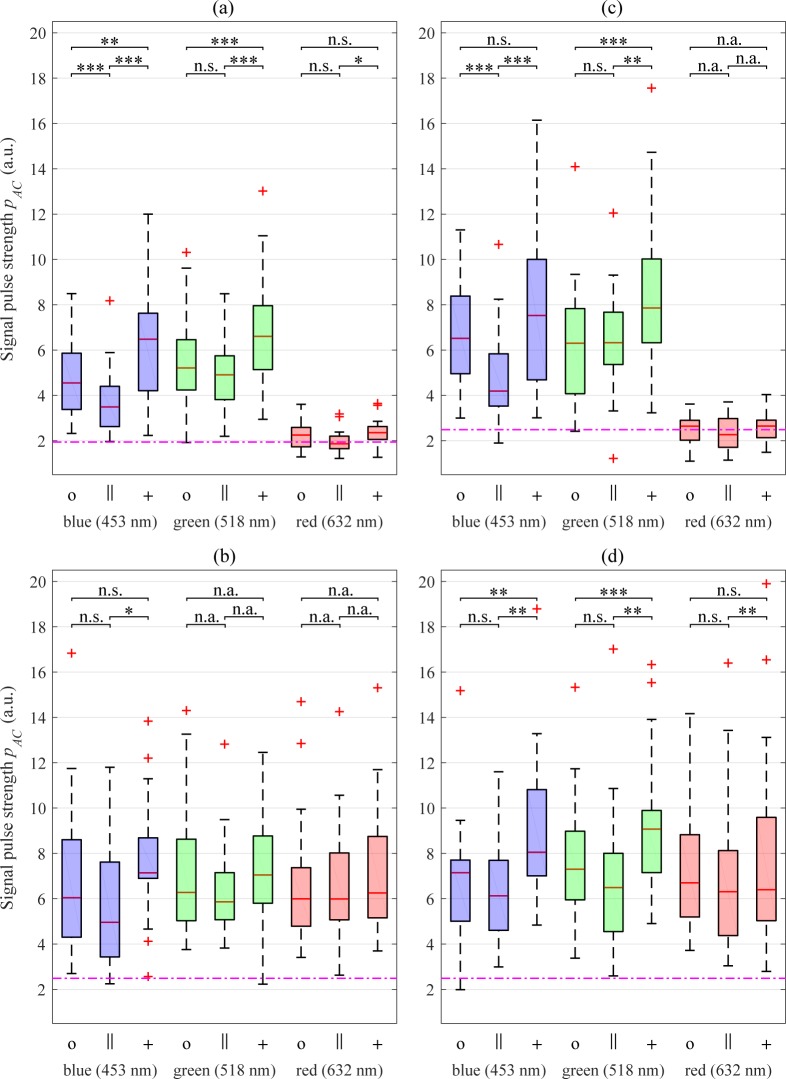
Fig. 4.
Boxplot for the distribution of the pulse strength values: (a) Full forehead ROI, (b) Left ROI, (c) Center ROI, (d) Right ROI. The results of post-hoc tests (filtration) are also given (n.s. p > 0.05, * p ≤ 0.05, ** p ≤ 0.01, *** p ≤ 0.001). If the post-hoc test was not applied, ’n.a.’ is used. The symbol ’o’ represents the setting without polarization filters, ’║’ the parallel setting and ’+’ the perpendicular setting. The chosen color setting is represented by boxes’ coloration and specified with their peak wavelengths (blue: 453 nm, green: 518 nm, red: 632 nm). The magenta lines depict the noise level nAC (see Section 2.3 for calculation).

