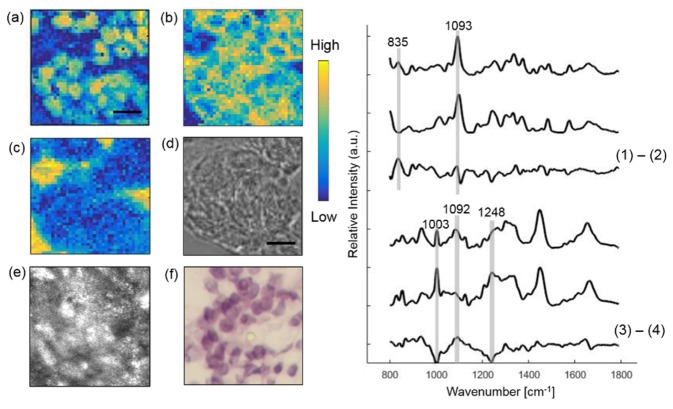
Fig. 2.
Extracting cellular components from a BCC lesion. Raman images of nucleus (a) and cytoplasm (b) and Raman substrate (c) are compared with bright-field image (d), CLSM image (e) and histopathology image (f). The boxes on (e) and (f) mark the location of Raman imaging. The contrast of the CLSM image was provided by the relative difference in refractive index of cells and the surrounding stroma. Plots on the right show Raman spectra of in situ nucleus, synthetic DNA and their difference spectrum. Also in situ cytoplasm, synthetic actin and their difference spectrum. Scale bar: 10 μm.

