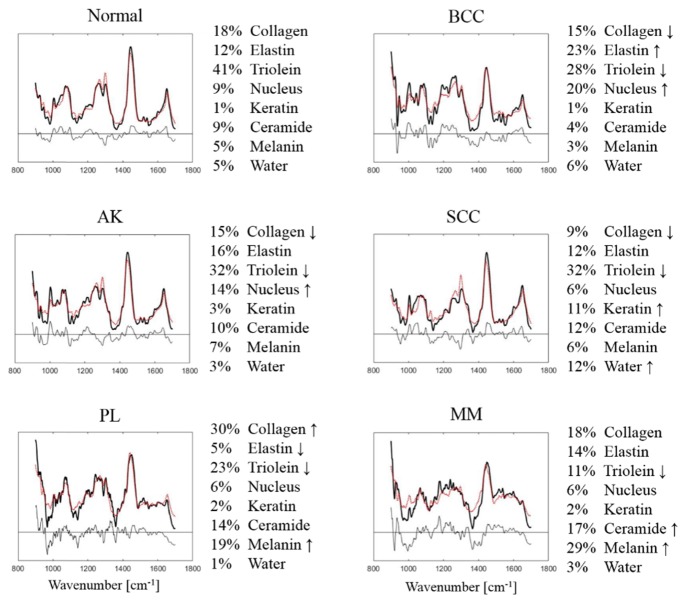
Fig. 9.
Model fitting results for in vivo human skin spectra categorized as Normal, BCC, SCC, AK, PL and MM. Mean Raman tissue spectra (solid lines), model fits (dotted lines), residuals are plotted on the same scale. Fit coefficients in percentage are listed on the right. The arrow indicates the most characteristic changes for each lesion type.

