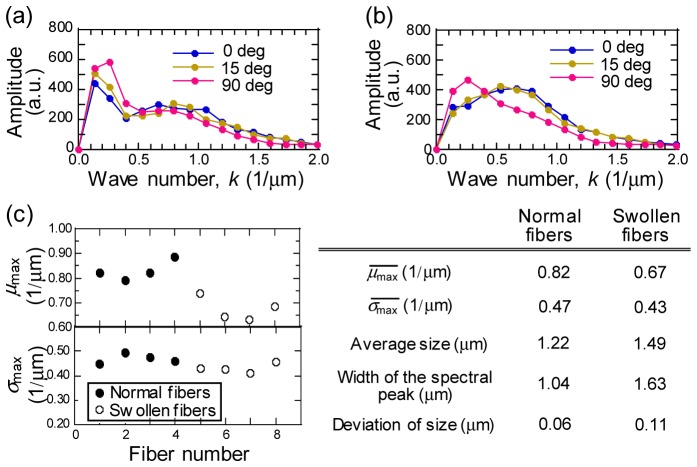
Fig. 4.
1D-FFT power spectra of PT image profiles for the normal fiber and the swollen fiber for images of Fig. 3(d) and 3(f), respectively. Line profile at 0, 15, and 90 degree from x axis defined in Fig. 3 are plotted. Power spectra are calculated by averaging spectra for 36 signal profiles for each angles with a sampling length of 7.5 μm. (c) Largest mean wave number of power spectra over all profile angles, , and corresponding standard deviation, . and in the Table are calculated by averaging and over four normal and four swollen fibers, respectively. Average size, width of the spectral peak, and deviation of size in the Table are derived from inverse of , and the deviation of among fibers, respectively.

