
Fig. 4.
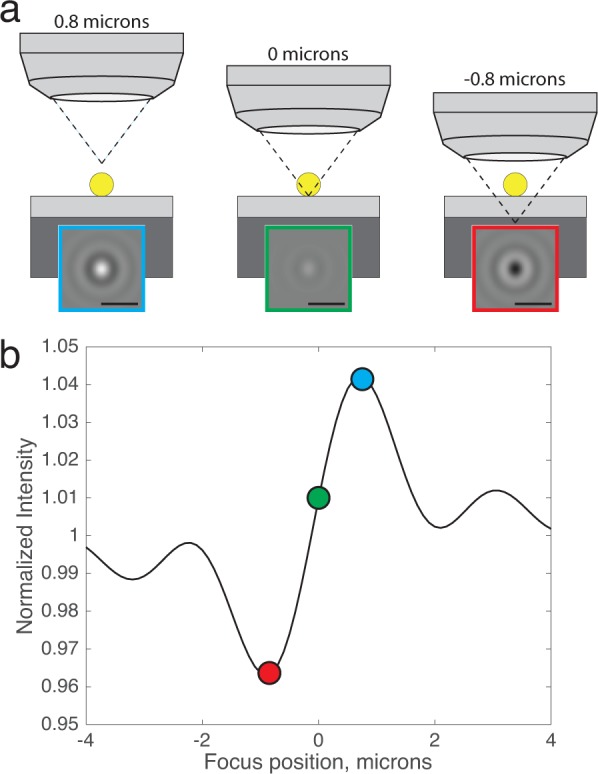
(a) Simulated images of a 100 nm virus with the microscope focal plane at three different positions with respect to the substrate top surface (NA = 0.9), scale bars are 1 1 µm). (b) The ‘defocus profile’: simulated normalized intensity at the center of the diffraction-limited image is plotted as a function of focus position, with the three focus positions labeled.