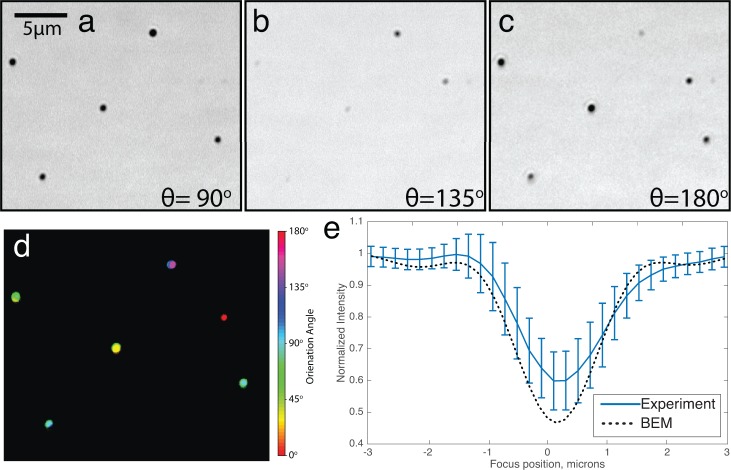
Fig. 6.
Validation of BEM simulations of gold nanorods. (a–c) Cropped slices from the 25x71 nm gold nanorod dataset described in text, where θ is the illumination polarization angle. (d) Hue-Saturation-Value representation after fitting a sinusoid to each spatial position pixel as a function of illumination polarization angle. Value (i.e., brightness) indicates the presence of a particle and Hue (i.e., color) indicates particle orientation. (e) Comparison of simulated and measured normalized intensity of a 25x71 nm gold nanorod aligned parallel to the illumination polarization direction, as a function of defocus (59 particles, 50 × 0.8 NA, λ = 630 nm).

