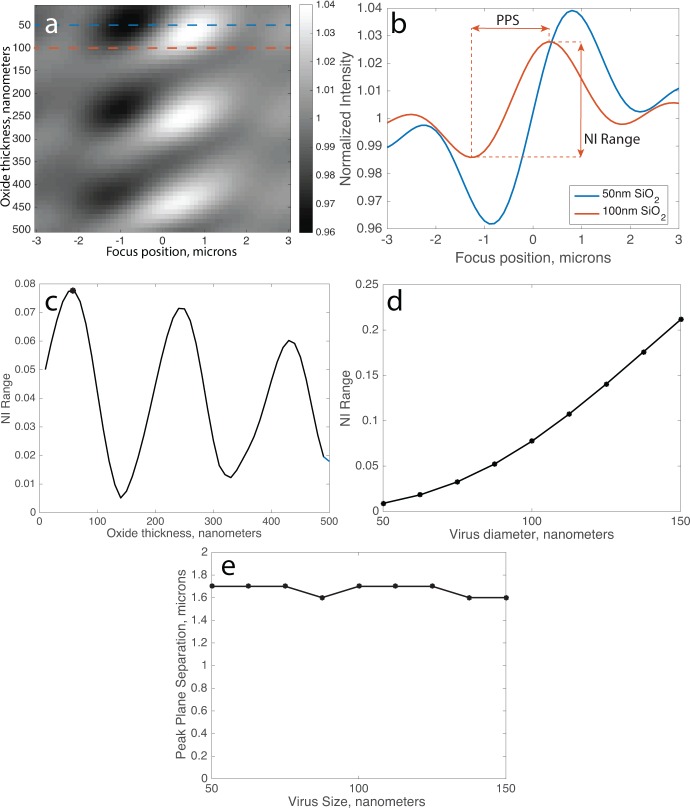
Fig. 7.
(a) Simulations of normalized intensity (at image center) of a 100 nm virus as a function of oxide film thickness and objective focus position. Two slices of this simulation where the film thickness is 50 or 100 nm are indicated by the dotted lines and plotted in (b) as defocus profiles. (c) NI Range for the range of oxide film thicknesses. (d) NI Range and (e) Peak plane separation are simulated for spherical virus between 50 and 150 nm in diameter on a 50 nm oxide film.

