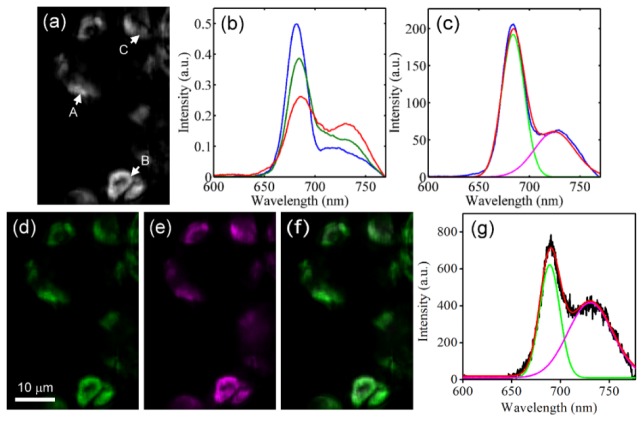
Fig. 5.
(a) The image of the leaf with intensity integrated throughout the whole spectrum range; (b) three normalized spectra at points A, B and C indicated with arrows in (a). (c) Gaussian fitting was applied to a recorded spectrum (blue) to find the spectral bases of PSII (green) and PSI (magenta). Red line shows the fitting result. (d)-(f) The images of (d) PSII and (e) PSI contents (normalized to within 0 and 1) obtained with linear unmixing and (f) the combination of PSII and PSI without normalization. (g) The linear unmixing result of a spectrum (black line). PSII and PSI components are represented by green and magenta and red line is the fitting result.

