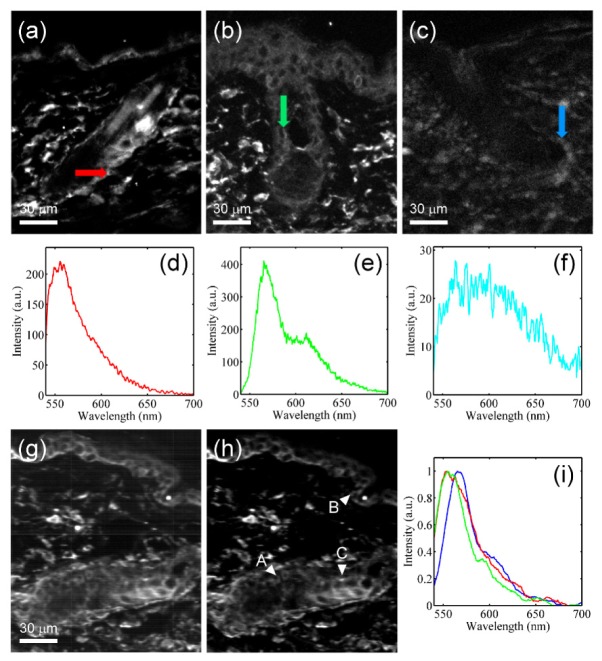
Fig. 6.
(a)-(c) The image of specimens singly stained with (a) Alexa 532, (b) Alexa 555 and (c) without staining, at a wavelength of 568 nm. (d)-(f) The spectrum bases of (d) Alexa 532, (e) Alexa 555 and (f) autofluorescence obtained from the positions indicated by arrows in (a)-(c). (g),(h) The image of a specimen with multiple staining, (g) with and (h) without optical sectioning. (i) Three spectra at positions A (blue), B (green) and C (red) indicated by arrowheads in (h).

