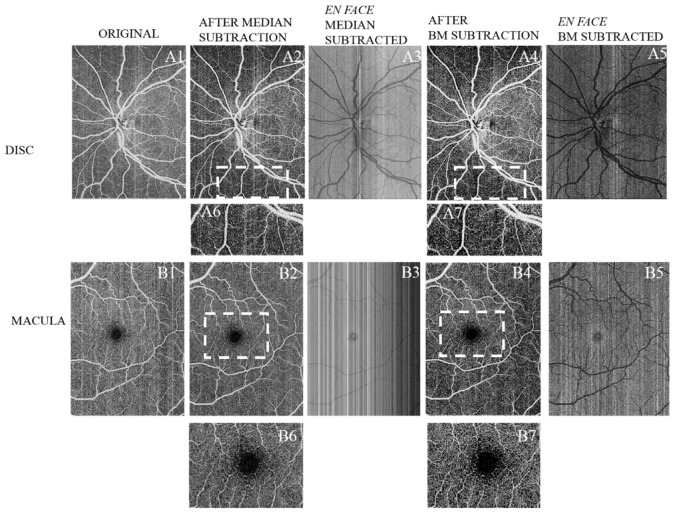
Fig. 8.
Qualitative comparison between median subtraction and regression-based bulk motion subtraction in an optic disc scan (A1-A7) and a macular scan (B1-B7).A1, B1 Unprocessed en face images. A2, B2 Scans after subtracting the median of the frame’s retinal region. A3, B3 are obtained by subtracting A1-A2 and B1-B2 respectively. A4, B4 Scans after regression-based bulk motion subtraction. A5, B5 are obtained by subtracting A1-A4 and B1-B4 respectively. A6 and A7 are close-ups of the 3.8mm × 1.7mm sections enclosed by dashed lines on A2 and A4 respectively.B6 and B7 are close-ups of the 3.4mm × 2.5mm sections enclosed by dashed lines on B2 and B4 respectively.

