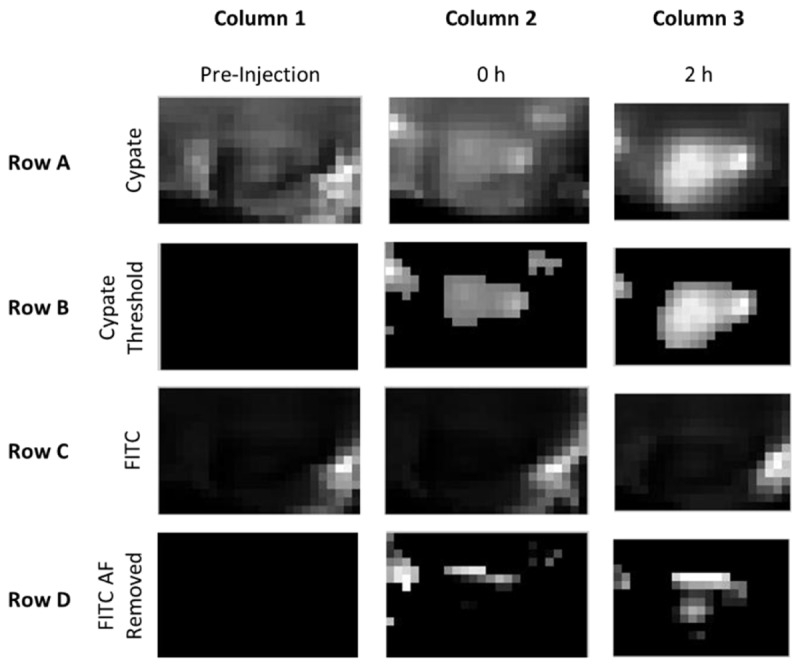
Fig. 5.

Overview of method for depth map generation from dual-wavelength imaging. Columns represent the (1) pre-injection image, (2) image immediately following the injection of the dye, and (3) image two hours following the injection of the dye. For intravenous probe administration, tumor accumulation of the dye was apparent at 2 hours post injection in the cypate channel (Row A, Column 3), so the 2 hour image was thresholded to determine the tumor ROI (Row B, Column 3). The FITC channel images contained high levels of auto-fluorescence from the hair and moderate levels in the skin (Row C). The tumor signal was not visible on a 0 – 255 grayscale until the high signal from the fur was removed. To remove the unwanted regions from the analysis, the pixels identified as the ROI using Cypate were applied to the FITC images (not shown). The remaining pixels were then compared to the average pre-injection FITC image values within the ROI. The pre-injection FITC image values were considered background and subtracted from the 2 hour FITC image, resulting in an FITC image that was of the ROI of interest with the pre-injection background values subtracted to remove auto-fluorescence (Row D, Column 3). The dual-wavelength images for cypate (Row B, Column 3) and FITC (Row D, Column 3) were used to calculate the depth estimate maps.
