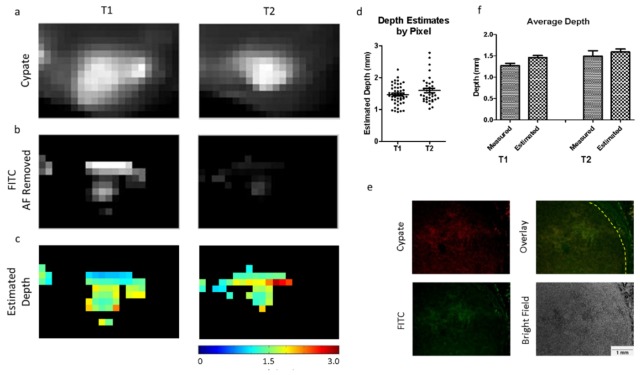
Fig. 8.
In vivo tumor images used for post processing. (a) Cypate images (top row), and (b) FITC images (bottom row) of the tumor regions (T1 and T2). The FITC image has the pre-injected auto-fluorescence subtracted from the tumor ROI. (c) Depth estimate maps for each of the tumors. (d) Pixel-by-pixel depth estimates for each tumor ROI. (e) Representative tumor histology (T2) showing cypate fluorescence (top left), FITC fluorescence (bottom left), overlay of both channels (top right), and bright field image (bottom right). (f) Comparison of average measured depth vs. average estimated depth for each tumor.

