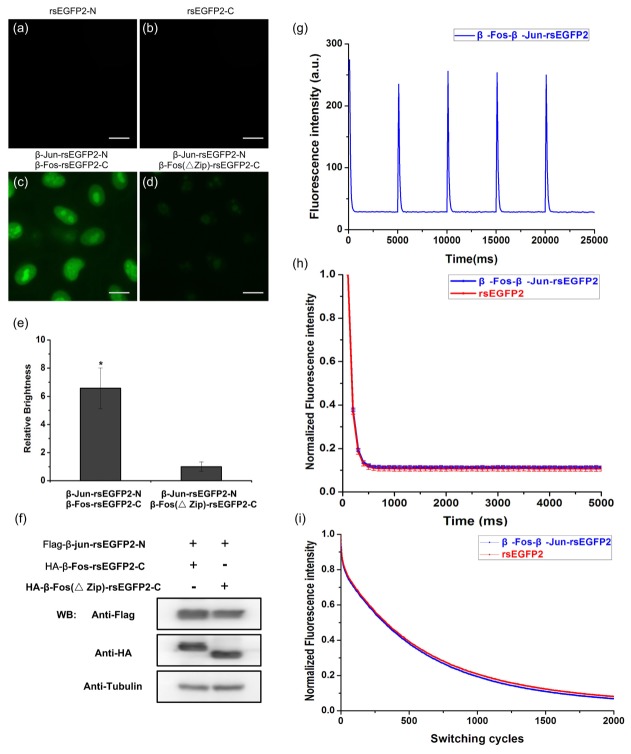
Fig. 2.
Split rsEGFP2 for BiFC analysis in live HeLa cells. HeLa cells individually expressing rsEGFP2-N fragment (a), rsEGFP2-C fragment (b), or co-expressing β-Jun-rsEGFP2-N and β-Fos-rsEGFP2-C (c) or co-expressing β-Jun-rsEGFP2-N and β-Fos(Δzip)-rsEGFP2-C (d) were imaged under a fluorescence microscope with a 100 × objective lens. The same intensity scale was applied to (c) and (d). Scale bar: 20μm. The relative brightness of cells expressing indicated plasmids were measured with fluorescence spectrophotometer in (e), *p<0.01 compared with cells expressing co-expressing β-Jun-rsEGFP2-N and β-Fos(Δzip)-rsEGFP2-C and the data were from three independent measurements. (f) Comparable expression level of the fusion proteins in (c) and (d) determined by western blotting with anti-Flag and anti-HA antibodies. (g) 5 consecutive off-switching curves of reconstituted rsEGFP2 (blue) in live HeLa cells co-expressing β-Jun-rsEGFP2-N and β-Fos-rsEGFP2-C by alternating irradiation with 405 nm light (25 W/cm2, 100 ms) and 488 nm (60 W/cm2, 5000 ms). Fluorescence was recorded only during irradiation of 488 nm light. (h) Single off-switching curve of reconstituted rsEGFP2 mediated by β-Jun/β-Fos interaction (blue) and full length rsEGFP2 (red) in live HeLa cells by alternating irradiation with 405 nm light (25 W/cm2, 100 ms) and 488 nm (60 W/cm2, 5000 ms). Fluorescence was recorded only during irradiation of 488 nm light. Each curve is an average of 10 switching cycles. (i) The photobleaching curves of reconstituted β-Fos-β-Jun-rsEGFP2 and full length rsEGFP2 were measured in live HeLa cells by alternating irradiation with 405nm light for on-switching (0.1 kW/cm2, 2ms) and 488nm light for off-switching (1 kW/cm2, 24ms) for each cycle.

