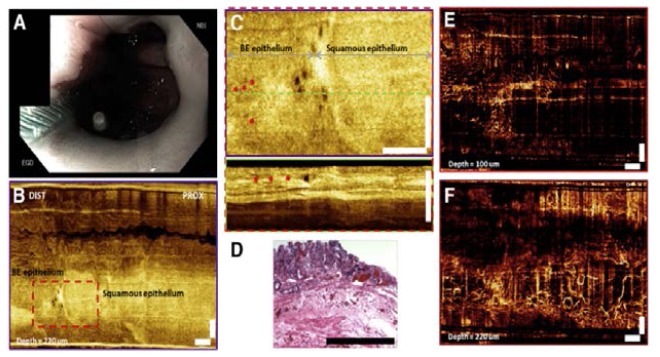
Fig. 15.
(A) Endoscopic view of BE using narrow band imaging. (B) En face OCT image at 220 mm depth (lamina propria layer). (C) Enlarged en face OCT image and the corresponding cross-sectional OCT image and (D) histology from the dashed red region in (B). En face OCT angiograms: (E) at 100 mm depth showing surface vasculature in the BE region, and (F) at 220 mm depth showing high density of microvasculature along the squamocolumnar junction. Red arrows, BE glands; white bar, 1 mm. (Figure and caption adapted from [44], with permission from Elsevier.)

