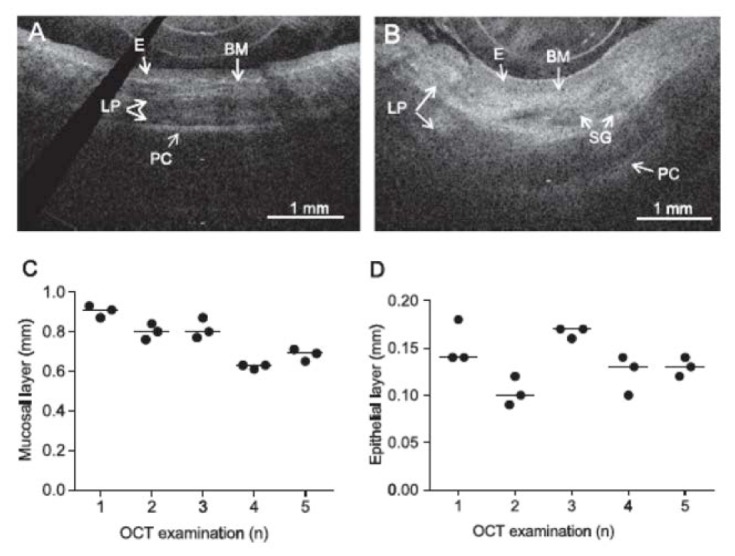
Fig. 31.

OCT images of the nasal mucosa from a healthy control (A) and a patient with CF (B), showing the epithelium (E), basement membrane (BM), lamina propria (LP) with seromucinous glands (SG) and perichondrium (PC). Validation measurements of nasal mucosa (C) and epithelial layer thickness (D) by OCT imaging in healthy controls. Data are presented as individual data points and median. (Figure and caption adapted from [42], with permission from Elsevier.)
