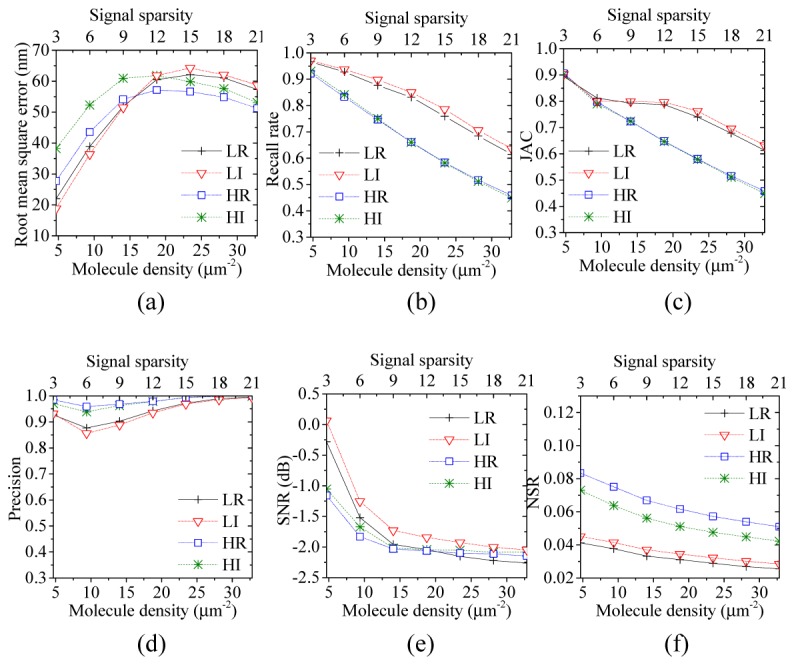
Fig. 1.

STORM image simulation analysis for LR, LI, HR, and HI based on CS and EPFL website data. The x axes represent molecule density and signal sparsity. (a) Comparison of measures of localization precision. (b) Comparison of recall rates. (c) Comparison of the JAC values. (d) Comparison of precision measures. (e) Comparison of SNRs. (f) Comparison of NSRs.
