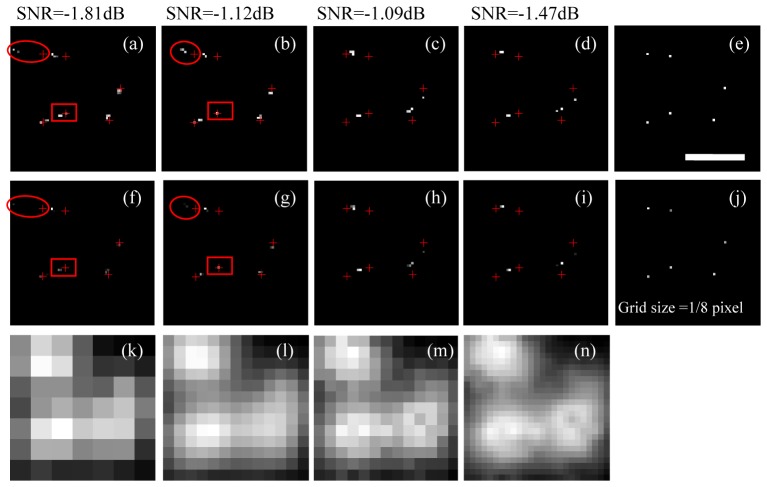
Fig. 2.
STORM image simulation analysis using CS to demonstrate its capability for identifying molecules efficiently at high densities. The scale bar in (e) is 200 nm. (a) The reconstructed result of an LR raw image. (b) The reconstructed result of an LI raw image. (c) The reconstructed result of an HR raw image. (d) The reconstructed result of an HI raw image. (e) True positions of six molecules. In (a)–(e), results were obtained after taking the logarithm of (f)–(j) based on real data. Thus, (f)–(j) correspond to (a)–(e). (k) A low-resolution raw image of STORM. The grid size of (a)–(j) equals 1/8 pixel of (k). (l) An interpolated low-resolution raw image of STORM. (m) A high-resolution raw image of STORM. (n) An interpolated high-resolution raw image of STORM.

