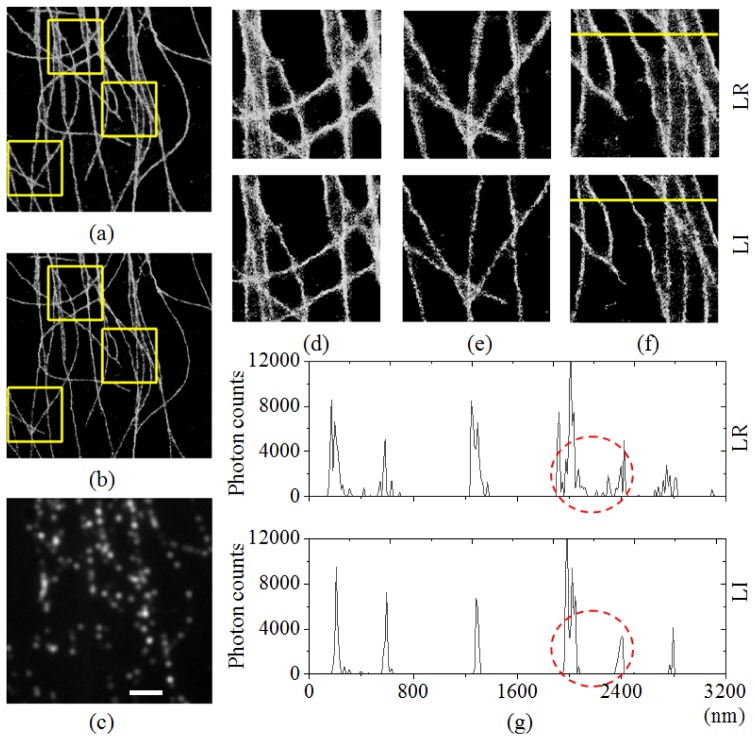
Fig. 3.
Comparison of LR and LI based on experimental 2D high-density data (500 raw images) from the EPFL website. The yellow squares in (a) and (b) are 3200 × 3200 nm, and the scale bar in (c) indicates 2000 nm. (a) A reconstructed result of LR. (b) A reconstructed result of LI. (c) A frame of a raw STORM images. (d) Enlarged LR and LI images from the top areas marked by yellow squares in (a) and (b), respectively. (e) Enlarged LR and LI images from the middle areas marked by yellow squares in (a) and (b), respectively. (e) Enlarged LR and LI images from the bottom areas marked by yellow squares in (a) and (b), respectively. (g) Plots of photon-count profiles obtained by measurements made along the yellow lines in (f).

