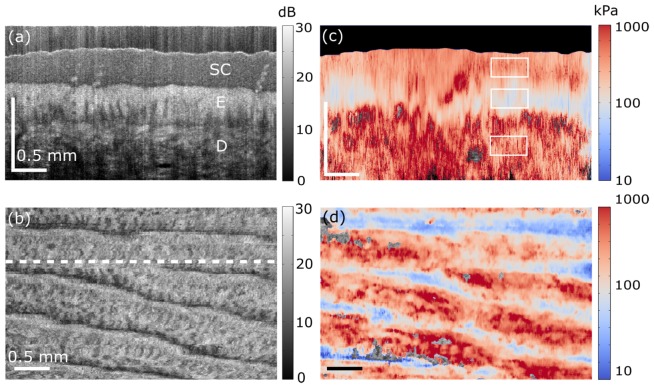
Fig. 3.
In vivo quantitative micro-elastography results from a fingertip. (a) OCT B-scan. SC, E and D in the image indicate stratum corneum, living epidermis, and dermis, respectively. The scale bar is 0.5 mm in both dimensions, but in depth indicates optical path length. (b) En face OCT image, 300 μm (physical length) beyond the interface of the compliant layer and the skin surface. The white dashed line indicates the B-scan location presented in (a). (c) B-scan micro-elastogram. (d) En face micro-elastogram, 300 μm (physical length) beyond the interface of the compliant layer and the skin surface, overlaid on the en face OCT.

