Fig. 4.
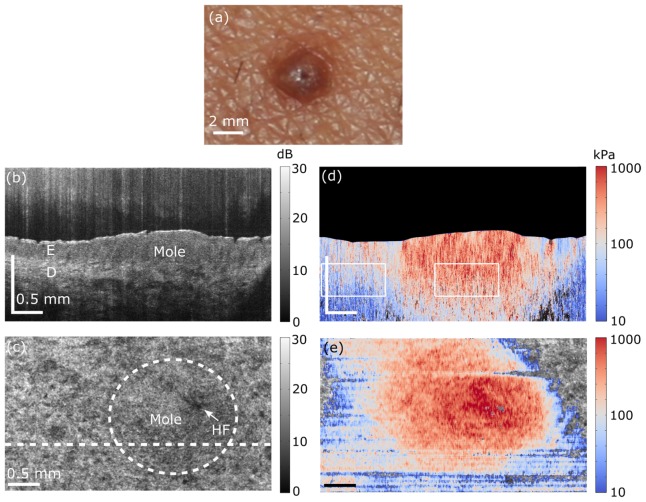
In vivo quantitative micro-elastography results from a mole on the forearm. (a) Photograph of mole. (b) OCT B-scan. The scale bar in depth indicates optical path length. E, living epidermis; D, Dermis. (c) En face OCT image, 185 μm (physical length) beyond the interface of the compliant layer and the skin surface. HF shows the prominent position of a hair follicle. White dashed line shows the B-scan location presented in (b) and circular white dashed line shows the approximate location of mole. (d) B-scan micro-elastogram overlaid on the OCT B-scan. (e) En face micro-elastogram, 185 μm (physical length) beyond the interface of the compliant layer and the skin surface, overlaid on the en face OCT.

