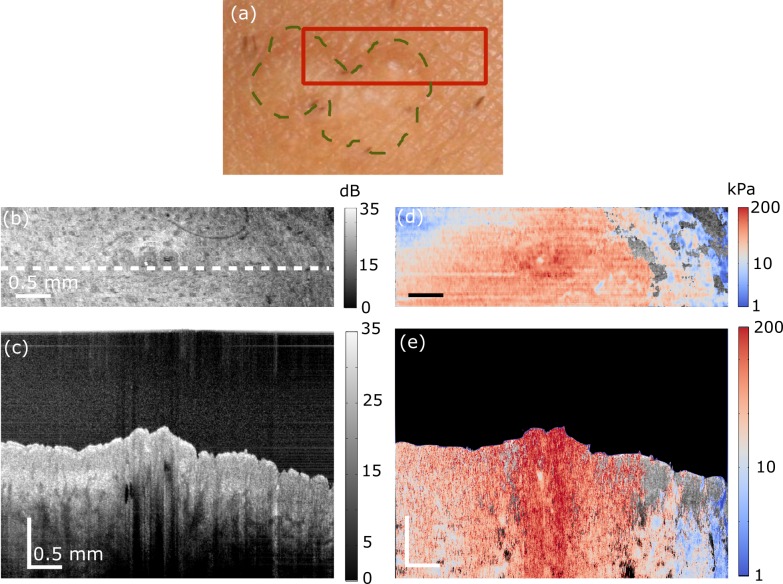
Fig. 5.
In vivo quantitative micro-elastography results from a burn scar on the wrist over the radial bone. (a) Photograph of the scar. Dashed green line delineates the scar border and the red box shows the region scanned. (b) OCT B-scan. The scale bar in depth represents optical path length. (c) En face OCT image, 100 μm (physical length) beyond the interface of the compliant layer and the skin surface. White dashed line shows the B-scan location presented in (b). (d) B-scan micro-elastogram overlaid on the OCT B-scan. (e) En face micro-elastogram, 100 μm (physical length) beyond the interface of the compliant layer and the skin surface, overlaid on the en face OCT.

