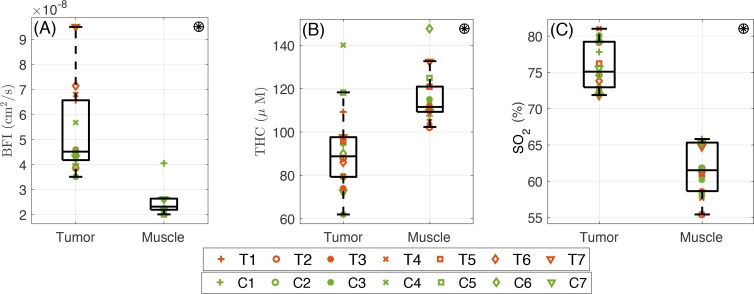
Fig. 3.
The optically measured pretreatment (day zero) hemodynamic properties of the RCC tumor in comparison with the control muscle. From left to right: (A) The higher than healthy shoulder muscle value (P< 10−4). (B) The total hemoglobin concentration in the tumor is lower than the healthy shoulder muscle (P = 8×10⁻⁴). (C) Blood oxygen saturation of the RCC in the tumor is higher than healthy shoulder muscle (P< 10−4). Symbol ⊛ indicates statistically significant difference between two locations (tumor and muscle).

