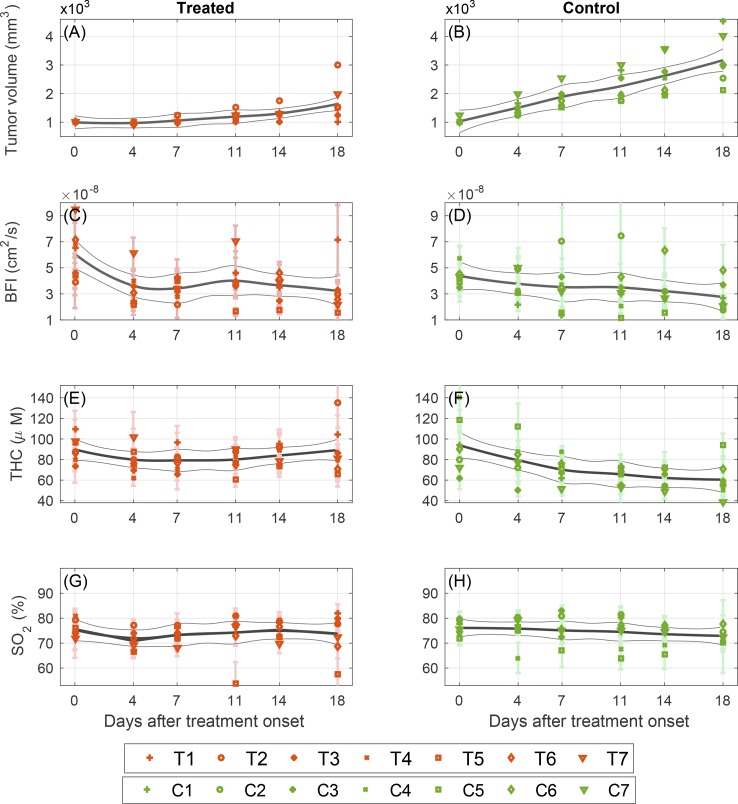
Fig. 5.
Daily changes of tumor size and optically measured hemodynamic parameters during the first 18 days, which corresponds to the period when no mouse had been sacrificed, for groups of seven treated (T1–T7) in left column and seven control animals (C1–C7) in right column. Each marker and error bar represent the value corresponding to average and standard deviation of measurement over all tumor locations on a specific mouse. The solid line is a fitted LOESS curve and the gray lines are the 95% confidence intervals. (A, B) represent tumor sizes measured by palpation, (C, D) blood flow index, (E, F), total hemoglobin concentration, and (G, H) Oxygen saturation.

