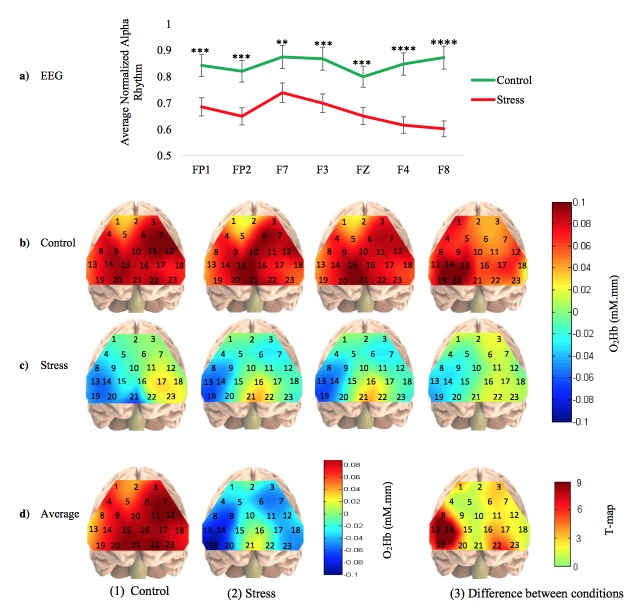
Fig. 3.
Results. (a) Normalized alpha rhythm obtained from all EEG electrodes. The marks ‘**’, ‘***’ and ‘****’ indicate that, the task is significant with p<0.01, p<0.001 and p<0.0001, respectively. (b) Mean change in oxygenated hemoglobin concentrations of four example subjects under control condition. (c) Mean change in oxygenated hemoglobin concentrations of the same subjects under stress condition. (d) Mean change in oxygenated hemoglobin concentrations of all 25 subjects, (1) under control condition, (2) under stress condition and (3) average T-map of between control and stress conditions. The numbers 1 to 23 in each topographical image indicate the number of particular channel at that location.

