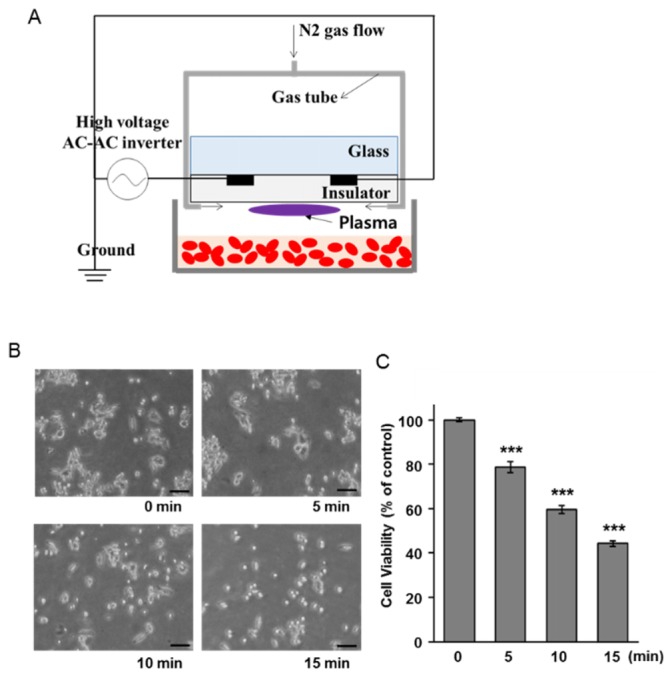
Fig. 1.

Anticancer effects of non-thermal plasma on HCT116 cells. (A) Schematic diagram of non-thermal plasma treatment. (B) The microscopic images of HCT116 cells at 24 h after plasma exposure. Scale bar = 100 μm. (C) MTT assay was performed using cells at 24 h after specific treatment. The data are presented as the mean ± SEM. *** denotes p < 0.001 compared to the unexposed cells.
