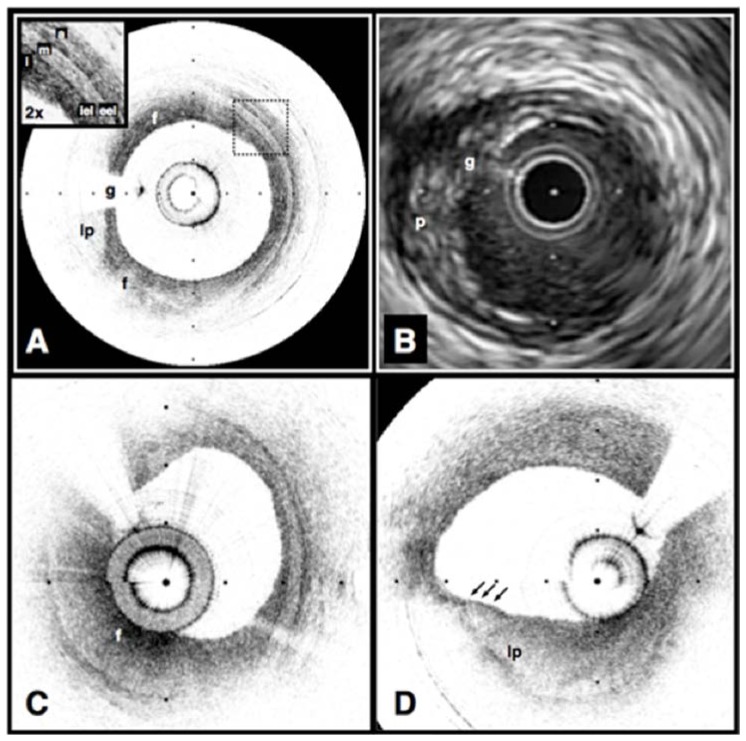
Fig. 7.
Echolucent coronary plaque imaged in vivo by optical coherence tomography (OCT) (A) and intravascular ultrasound (IVUS) (B). (A) An atherosclerotic plaque extending from 5 o’clock to 12 o’clock contains regions consistent with fibrous tissue (f) and a homogeneous, signal-poor region (lp), which is partially obscured by a guidewire shadow artifact (g). Fibrous plaque (C), showing characteristic high, homogeneous signal (f). Example of thin-capped lipid-rich plaque (D). Tick marks, 1 mm. OCT displayed in inverse gray scale. Reprinted from [47].

