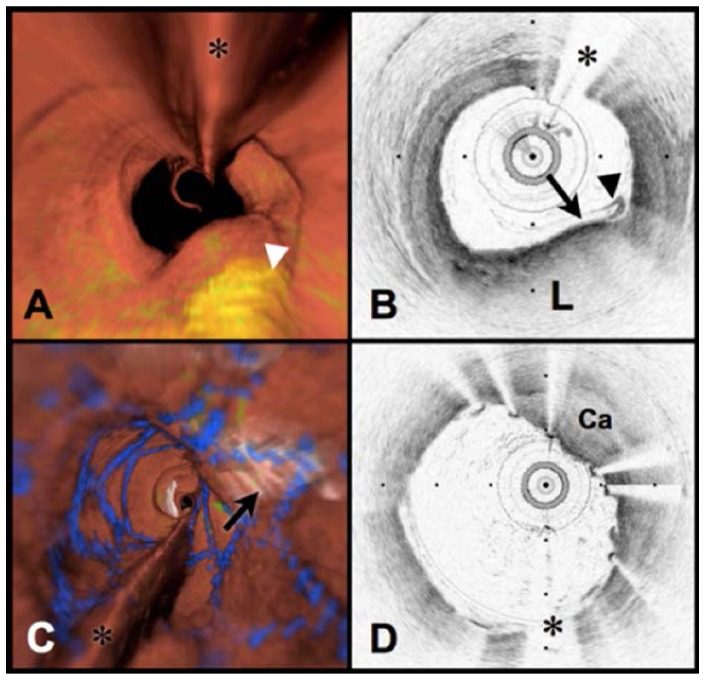
Fig. 11.
Volumetric OFDI imaging of the human LAD coronary artery, obtained in vivo. A. Fly-through rendering view (proximal-distal) of the OFDI data set, acquired during a single purge of Lactated Ringers solution (3 ml/s), an imaging catheter pullback rate of 2.0 cm/s and at an image acquisition rate of 100 frames per second. The fly-through depicts a yellow, elevated lipid-rich lesion with scattered macrophages (green). B. OFDI cross-sectional image obtained at the location of the white arrowhead in (A) demonstrates OFDI evidence of a thin-capped fibroatheroma; a lipid pool (L), a thin cap (black arrow), and a dense band of macrophages at the cap-lipid pool interface. A thin flap of tissue (black arrowhead) can be seen over the cap. C. Fly-through view (proximal to distal) shows a calcified lesion (black arrow) beneath a newly deployed stent. D. OFDI cross-sectional image obtained at the location of the black arrow in (C) demonstrates a large calcific nodule (Ca) from 11 to 5 o’clock causing significant stent distortion, highlighted by the shorter inter-strut distances of the overlying stent compared to the opposing vessel wall. Color scale for A and C: red – artery wall; green – macrophages; yellow - lipid pool; blue – stent. Tick marks, 1 mm. OCT displayed in inverse gray scale. * denotes guide wire artifact. Reprinted from [84] with permission from Elsevier.

