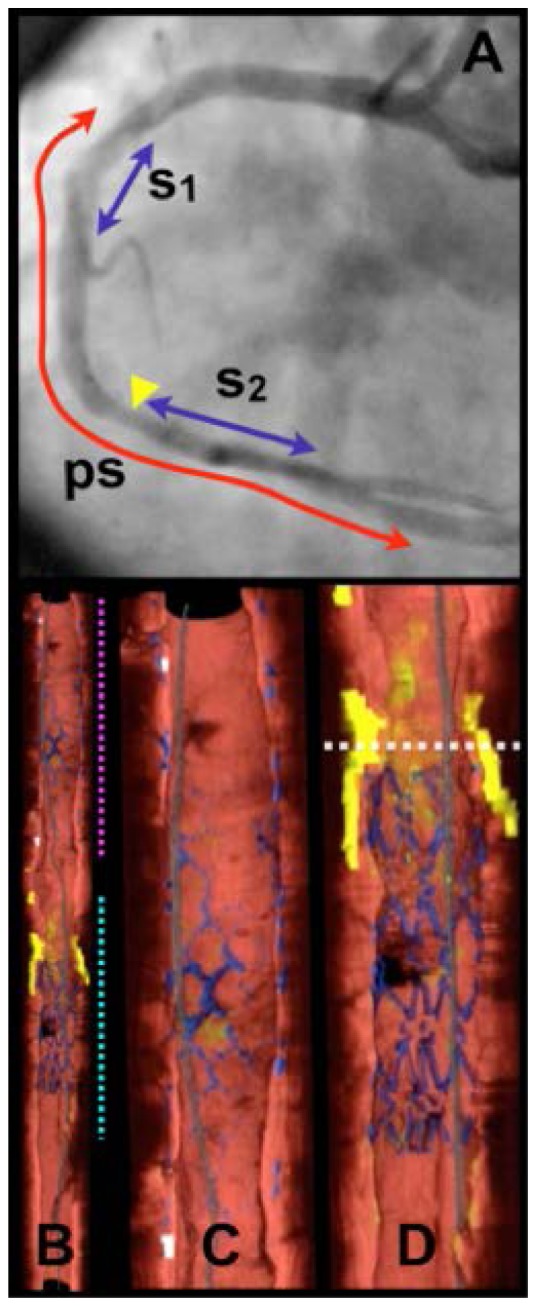
Fig. 12.

Images of human right coronary artery acquired in vivo. A. Angiogram following stent deployment, showing stent deployed 9 years previously (s1) and stent (s2) that was deployed immediately prior to imaging. 7.0 cm pullback segment (ps). B. Cutaway view of entire three-dimensional volume rendered data set (top – proximal; bottom – distal). C. Expanded view of segment denoted by magenta dotted line in (B), showing stent s1. D. Expanded view of segment denoted by cyan dotted line in (B), showing stent s2. White dotted line in (D) is through a lipid-rich lesion, proximal to s2. Color scale for B - D: red – artery wall; green – macrophages; yellow - lipid pool; blue – stent; gray – guide wire. Reprinted from [83].
