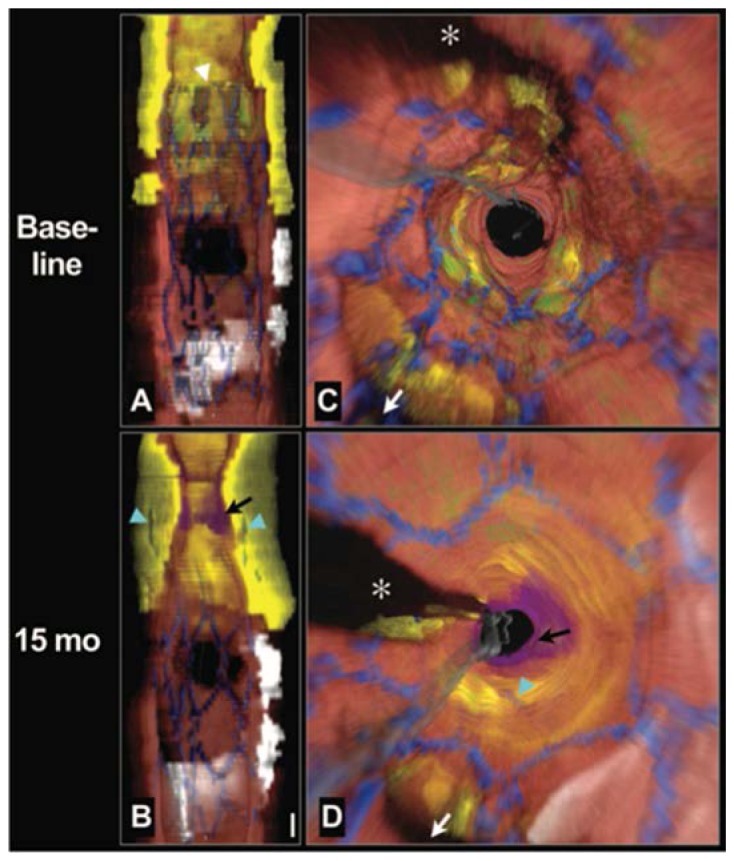
Fig. 13.

Longitudinal cutaway view (A) and fly-through view (C) at baseline demonstrates that the stent was deployed over a large circumferential lipid core and that the proximal stent margin was placed in the center of the lesion (white arrowhead). Longitudinal cutaway view (B) and fly-through view (D) at 15 months shows that the necrotic core had grown or prolapsed into the lumen, leaving the struts embedded deep within the plaque (cyan arrows). A thrombus formed near the stent edge (black arrows). Red color indicates artery wall; green, macrophages; yellow, lipid core; blue, stent; white, calcium; purple, thrombus; gray, guide wire. White arrow denotes side branch in (C) and (D). *Guide wire shadow. Scale bar in (B), 1 mm (for both A and B). Fly-through views are presented from a distal to proximal perspective. From Circulation Cardiovascular Interventions 3, 193-196 (2010).
