
Fig. 17.
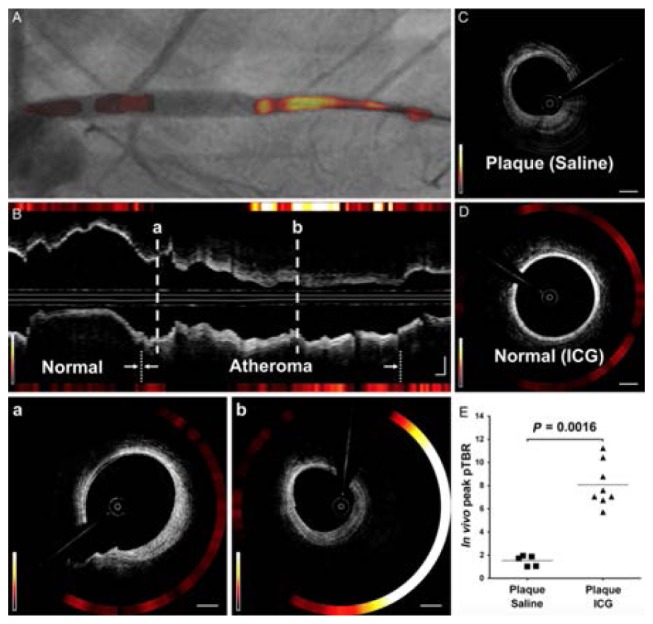
In vivo optical coherence tomography-near-infrared fluorescence (OCT-NIRF) imaging. (A) Image of contoured 2-D NIRF map overlaid on angiography. (B) Corresponding longitudinal OCT-NIRF image. (B a) Weak NIRF activity on fibrotic OCT signal pattern. (B, b) Strong NIRF activity on fibrofatty OCT signal pattern. (C) Saline-injected control. (D) Normal-looking artery. (E) Comparisons of peak pTBR. Equally windowed. Reprinted from [121], by permission of Oxford University Press.