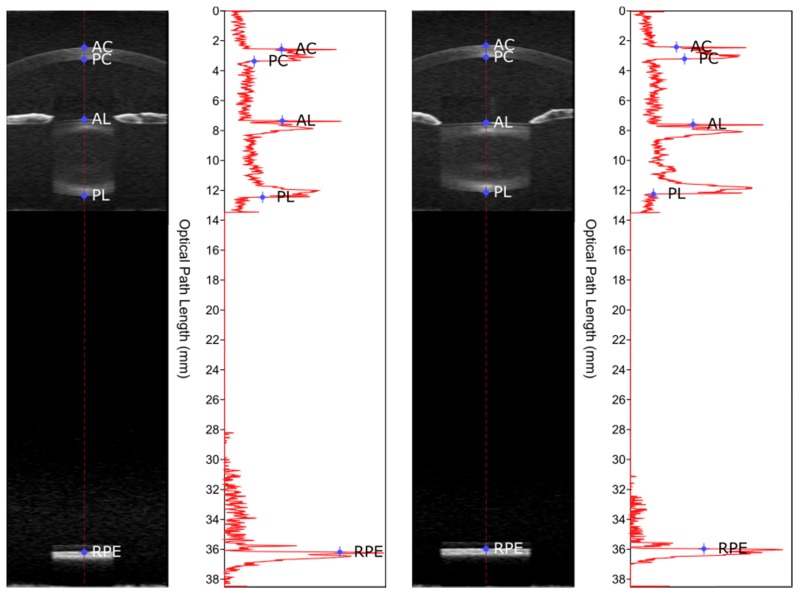
Fig. 1.
Example of measurements derived from SD-OCT images. The figure shows images of the eye and the corresponding intensity profile of the A-line at the corneal apex while accommodated in response to stimulus at 6 D (left) and while relaxed at 0 D (right). Boundaries of ocular structures were determined through automated segmentation and are indicated by points on the A-line of the corneal apex and on the intensity profile (AC = anterior cornea, PC = posterior cornea, AL = anterior lens, PL = posterior lens, RPE = retinal pigment epithelium). A video of an example response to a stimulus at 6 D from the same subject is shown in Visualization 1 (33.9MB, AVI) .

