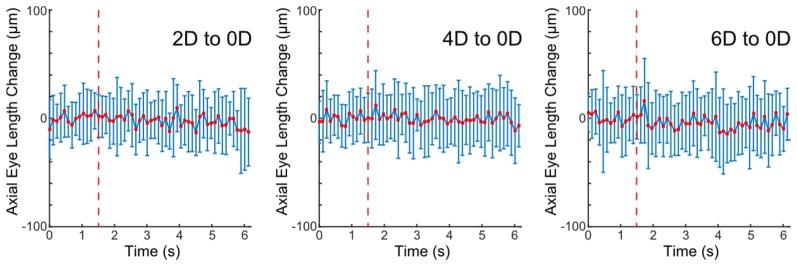
Fig. 4.
Average and standard deviation of axial eye length change (change from baseline axial eye length at accommodation) over all subject trials at each timepoint. Individual plots shown from left to right represent responses at 2, 4 and 6 D stimulus conditions, respectively. The timing of stimulus presentation is indicated by a dotted red line.

