Abstract
In photoacoustic computed tomography, the limited directivity of the detectors may cause deformation of off-center targets and lead to an imbalanced resolution in the imaging area. To improve the directivity of the acoustic detectors, several negative acoustic lenses have been proposed. In this study, we develop a new compound acoustic lens fabricated by integrating a concave polydimethylsiloxane (PDMS) lens and a convex epoxy lens. Both theoretical simulations and experimental evaluations demonstrate that the compound lens provides a larger directivity compared to single lenses made of PDMS, epoxy, and liquid. The measured acceptance angles of a 6-mm piezoelectric acoustic transducer equipped with the compound, epoxy, liquid, and PDMS lenses are 55°, 36°, 25°, and 20°, respectively. No deformation is observed in the off-center targets by using compound lens. However, serious deformation appears in the cases using single lenses.
OCIS codes: (170.5120) Photoacoustic imaging, (110.0110) Imaging systems
1. Introduction
Over the past decade, there has been considerable interest in photoacoustic imaging (PAI) due to its rich optical contrast, high acoustic resolution, and relatively deep penetration [1]. In general, PAI can be divided into photoacoustic microscopy (PAM) and photoacoustic computed tomography (PACT) [2]. In PAM, which has been widely used to investigate vasculature networks, small animal-based tumor models, nanomaterials and brain functions, self- or lens- focused transducers are always used to form a converging acoustic detection [3–6]. The self-focused transducer uses a curved piezoelectric crystal, and the lens-focused transducer combines a flat piezoelectric crystal with a positive acoustic lens [7, 8]. As opposed to PAM, PACT is a reconstruction-based macroscopic imaging modality, and has been demonstrated in clinical and biological applications such as breast cancer detection, lymph node staging, arthritis screening, brain studies, diabetes alerts, and whole-body imaging for small animals [9–11]. In a typical circular/spherical scanning-based PACT, the directivity of the transducer affects the tangential resolution determining the spatial resolving ability along the tangential/scanning direction, and thus influence the imaging quality in the off-center area [12]. Theoretically, directivity of a single finite-size flat transducer is defined by the acoustic radiation angle in which the radiation power decreases to −6 dB of the peak power in the center [13, 14]. Without sufficient directivity, there will be degradation in the tangential resolution leading to serious deformation of the off-center targets. To solve this problem, point detectors with an extra small active area, such as hydrophone, are always employed [15]; however, the sensitivity is relatively low and therefore causes a low signal to noise ratio (SNR) of the raw signals. Another method is to integrate flat transducers and negative acoustic lenses [16]. In ultrasound imaging, epoxy is generally used to fabricate acoustic lenses due to its high acoustic velocity and low acoustic impedance [17–19]. Recently, a number of new materials have been discovered to make acoustic lenses for photoacoustic imaging. Wang et al. developed a negative acoustic lens made of acrylic and evaluated its performance via conventional two-dimensional (2D) circular scanning-based PACT [20]. Xia et al. reported a new material with a similar acoustic impedance to water for three-dimensional (3D) PACT for breast cancer detection [21]. Chang introduced the fabrication of a polydimethylsiloxane (PDMS) acoustic lens for a capacitive micro-machined ultrasonic transducer (CMUT) array [22]. Song and Xi invented a multifunctional liquid acoustic lens for both PAM and PACT [23, 24]. In this paper, we report a new compound acoustic lens made by integrating a convex lens fabricated with epoxy and a concave lens made of PDMS, and further compared it with three single acoustic lenses made of epoxy, PDMS, and liquid. Both the simulation and experimental results indicate that the compound lens offers the best directivity enlargement, and thus there is no deformation in the phantom experiments.
2. Methods and materials
2.1 Fabrication of lenses
Figure 1 shows the fabrication process of the acoustic lenses. A lens mold was built by a 3D printer (Fig. 1(a)). PDMS liquid consisted of two components (silicone elastomer base and curing agent) mixed in a weight ratio of 10:1. After fully mixing, PDMS liquid was poured into the mold and thoroughly degassed using a vacuum. A steel ball with a diameter of 7 mm was dipped into the PDMS liquid in the center of the mold via a precise 3D manipulator (Fig. 1(b)). Then the mold was kept in an incubator and heated with a constant temperature of 80 °C for 40 minutes. When PDMS was fully cured, both the steel ball and PDMS were carefully peeled off from the mold (Fig. 1(c)). The epoxy liquid (Epoteck 301, Epoxy Technology Inc.) was also mixed from two components with a weight ratio of 1:0.35. To fabricate a compound lens, after mixing and degassing, it was poured into a PDMS lens and the top surface was kept flat using a cover glass. After heating in the incubator at 80 °C for 60 minutes, the cover glass was peeled off from the top surface of the epoxy (Fig. 1(d)). An epoxy lens was available through peeling off the epoxy part from the compound lens (Fig. 1(e)). The detailed fabrication process of a negative liquid lens was introduced in our previous publications [23, 24]. To achieve acoustic diverging, the cavity of the liquid lens was filled with pure glycerol with a sound velocity of 1920 m/s [23].
Fig. 1.
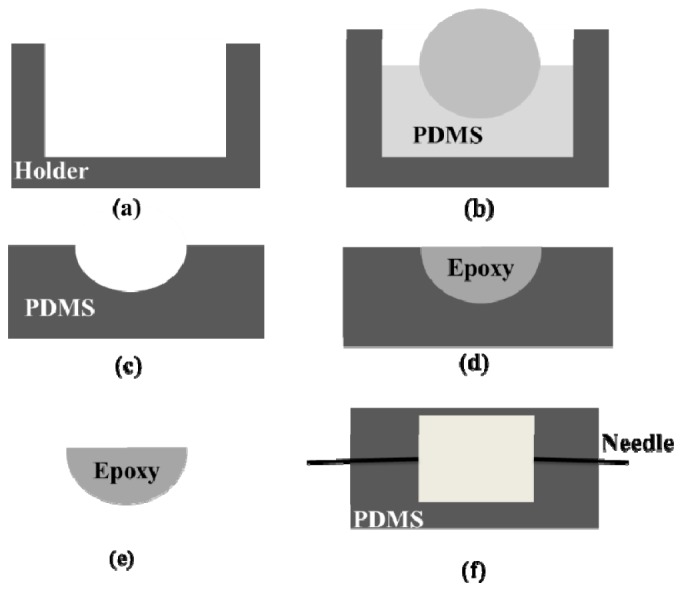
Fabrication process of the lenses. (a) The lens mold was built using a 3D printer, (b) PDMS liquid was poured into the mold and a steel ball was dipped into the PDMS solution, (c) after cured at 80 °C, PDMS lens was peeled off, (d) the epoxy liquid was filled into the PDMS lens to make the compound lens, (e) epoxy acoustic lens was peeled off from the compound lens, (f) liquid was infused into the chamber through the holes to form a liquid lens.
2.2 Theoretical simulation of the lenses
We used the pressure acoustics module (frequency-domain) in COMSOL Multiphysics 5.2 (COMSOL Co. Ltd.) to simulate the theoretical acoustic distributions of both the flat and the lensed transducers with given parameters in Table 1. The active aperture and center frequency of the simulated transducer in the mechanical/vibrational model are 6.35 mm and 2.25 MHz, respectively, which are consistent with the experimental transducer. All the lenses in the simulation have the same diameter of 7 mm. The radius of the lens curvature is 3.5 mm. The size of the grid was smaller than a quarter of the sound wavelength in the medium. In the simulations, the 2D acoustic pressure distribution of each case is computed.
Table 1. Acoustic properties of different lenses.
| Material | Velocity (m/s) | Density (kg/m3) | Impedance (MRayls) |
|---|---|---|---|
| No lens (water) | 1480 | 1000 | 1.48 |
| Compound | NA | NA | NA |
| Compound-reverse | NA | NA | NA |
| Epoxy | 2640 | 1080 | 2.85 |
| Liquid | 1920 | 960 | 1.84 |
| PDMS | 950 | 1580 | 1.5 |
2.3 Experimental evaluation of the acoustic lenses
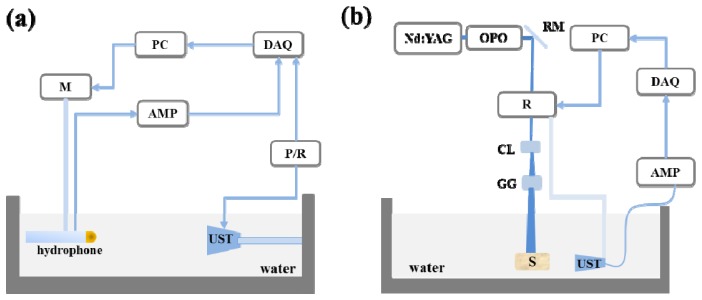
Figure 2(a) depicts the system to map the acoustic distributions of the flat and lensed acoustic transducers. In this system, a commercial piezoelectric ceramic transducer (V133, Olympus Inc.) with a center frequency of 2.25 MHz, a bandwidth of 85%, and an active area of 6.35 mm in diameter was fixed in the water tank. The acoustic lenses were attached to the surface of the transducer with a thin layer of ultrasound gel and immobilized using epoxy sleeves. A pulser/receiver (5073PR, Olympus Inc.) was employed to generate acoustic waves through the transducer. A hydrophone (HNR-080, ONDA) was mounted on a three-dimensional (3D) motorized stage (TSA-100, Zolix Inc.), and scanned a rectangular area of 60 mm × 70 mm to detect the acoustic pressures with a scanning step of 0.5 mm. We did Hilbert transform of the raw acoustic pressures, and back-projected the normalized peak values to draw the acoustic distribution maps.
Fig. 2.
The schematic of the experimental systems to evaluate the flat and lensed transducers. (a) Acoustic mapping system to measure the acoustic distributions of the flat and lensed transducers. (b) A typical circular-scanning-based PACT system. M: Motorized stage; PC: Personal computer; DAQ: Data acquisition card; AMP: Amplifier; UST: Ultrasound transducer; P/R: Pulser/Receiver; R: Rotator; RM: Reflection Mirror; CL: Concave lens; GG: Ground glass; S: Samples.
In addition to mapping the acoustic distributions, we carried out four different phantom experiments. The background of the phantoms was made by mixing agar, intralipid, and ink to simulate optical absorption and scattering properties of the biological tissue. The given optical absorption and scattering coefficients were 0.007 mm−1 and 1 mm−1, respectively. The diameter of the background phantoms is 60 mm. In the first phantom, one pencil lead with a diameter of 0.5 mm was vertically inserted at the center of a background and the rest 24 pencil leads were embedded and aligned in two perpendicular directions. In the second phantom, four 6 mm circular targets with an optical absorption coefficient of 0.028 mm−1 and an optical scattering coefficient of 2 mm−1 were distributed in the background. Target 1 was positioned at the center, target 2 and 3 were placed with horizontal distances of 10 mm and 15 mm off the center, and target 4 had a horizontal distance of 10 mm off the center and a vertical distance of 5 mm below the scanning plane. We estimated the tangential resolutions for both in-center and off-center targets based on the full width at half maximum (FWHM) of the point spread functions (PSFs). PSFs were derived from the edge spread functions (ESFs) of the imaged targets. In additional experiments, we utilized pencil leads and human hairs to simulate the vasculature structures in mouse brains and tumor lesions.
All the phantom experiments were conducted using a traditional circular scanning PACT system reported in our previous publication [23]. Briefly, as shown in Fig. 2(b), laser pulses with a duration of 7 ns, a repetition rate of 20 Hz and a wavelength of 720 nm emitted from a tunable OPO laser (Magic Prism, Opotek Inc.) pumped by a Nd:YAG laser (Q-smart 450, Quantel Laser). The laser beam was re-directed by a reflection mirror (BB1-E02, Thorlabs Inc.) and passed through the central hole of a motorized rotator (RAP100, Zolix Inc.). A concave lens and a ground glass were employed to form a large-area homogeneous illumination pattern on the sample surface. The transducer was mounted on the rotator and scanned 360° with an angular step of 2°. The detected photoacoustic signals were amplified by a pre-amplifier (5073PR, Olympus Inc.) at ~39 dB and digitalized using a high-resolution data acquisition card (NI-5105, National Instruments Inc.) at a sampling rate of 60 Ms/S.
For image reconstruction, we used a linear algorithm named delay and sum with an assumption of a homogeneous sound velocity (1480 m/s) over the entire recovered domain [25].
3. Results and discussions
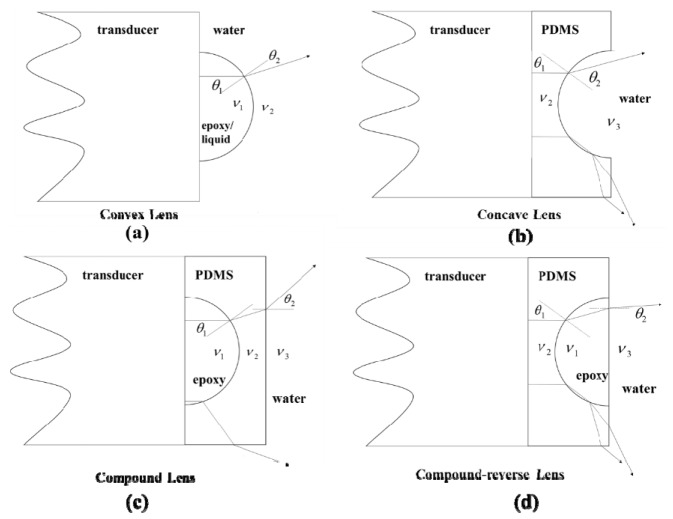
Figure 3 shows the geometries of the acoustic lenses, in which there are two convex lenses (epoxy and liquid), one concave lens (PDMS), and two compound lenses (compound and compound-reverse). By adding the lenses on the surface of the flat transducer, the emitted acoustic wave will be diverged, which comply with the Snell’s law.
| (1) |
In the equation, and represent the incidence angle and refraction angle, respectively, and are the acoustic velocities of the lens material and outside medium.
Fig. 3.
Geometries of the proposed acoustic lenses in the experiments. (a) Epoxy and liquid lenses have a convex shape. (b) PDMS lens has a concave shape. (c, d) The schematic of the compound and compound-reverse lenses.
The epoxy and liquid have higher acoustic velocities than water (>), hence they have a convex shape as shown in Fig. 3(a). PDMS has a concave shape (Fig. 3(b)) because its acoustic velocity is lower than water (<). From the Sell’s law, we can expect the divergence of the directivity by adding the single acoustic lenses (>in convex lens and<in concave lens). In two compound configurations (Fig. 3(c) and 3(d)),, , represent the acoustic velocities of epoxy, PDMS and water, and are the first incidence angle and last refractive angle. In Fig. 3(c), we clearly see that the acoustic wave is diverged twice at the boundaries. However, in the compound-reverse configuration, the acoustic wave is first diverged and then converged. In addition, for the compound-reverse lens, when the incidence angle () is larger than a critical angle, the acoustic wave will be fully reflected. Based on the theoretical analysis, we could expect that the compound acoustic lens has the best performance among all the described acoustic lenses.
To validate the theoretical deduction, we obtained the acoustic distributions of the flat and lensed transducers via both simulations and experiments. Figure 4 shows the simulated and experimental results of the flat transducer and the transducer equipped with the compound, compound-reverse, epoxy, liquid, and PDMS lenses. To quantitatively evaluate the directivity of the transducer in different cases, we plotted the profiles of acoustic pressures and selected two −6 dB points along the dashed yellow line (Fig. 4(a)) in all cases, and then connected each −6 dB point with the corresponding point at the edge of the transducer in the same side to form two straight lines and calculate the acceptance angle of the transducer in different cases. Since all the boundaries of the acoustic distribution maps have curved shapes, the acceptance angles derived using two straight lines do not represent actual directivities. However, if we calculated the acceptance angles under the same condition, it is feasible to do a relative comparison of directivity. We summarized the results of the directivity in Table 2. The directivity of a transducer without a lens (Fig. 4(a)) is much smaller than the cases with acoustic lenses. The case using a compound lens has the largest directivity (Fig. 4(b)). The directivity and sensitivity of the compound-reverse lens becomes worse compared to the compound lens, which is consistent with the theoretical analysis. It is known that partial acoustic waves will be absorbed by the lens material and reflected at the boundary formed by materials with different acoustic impedances. We further evaluated the attenuation of the acoustic lenses using the measured acoustic pressures at the same location of the acoustic distribution maps, and provided the peak-to-peak acoustic pressures in Table 2. We find that liquid lens and PDMS lens have the lowest attenuation due to the relatively low acoustic impedances of the lens materials. Compound and epoxy lenses have almost the same attenuation which is larger than that of liquid and PDMS lenses. Interestingly, in compound-reverse configuration, the attenuation is much stronger than that of other lenses due to serious reflection loss at the boundaries formed by difference lens materials. Commonly, in order to reduce the reflection, matching layers are used. In our case, from the data in Table 1, epoxy has the largest acoustic impedance of 2.85 MRayls, and PDMS and water have the similar acoustic impedances of 1.5 MRayls and 1.48 MRayls, respectively. In the compound lens, PDMS serves as the matching layer between the epoxy and water, and therefore results in a better sensitivity compared to the compound-reverse lens [21].
Fig. 4.
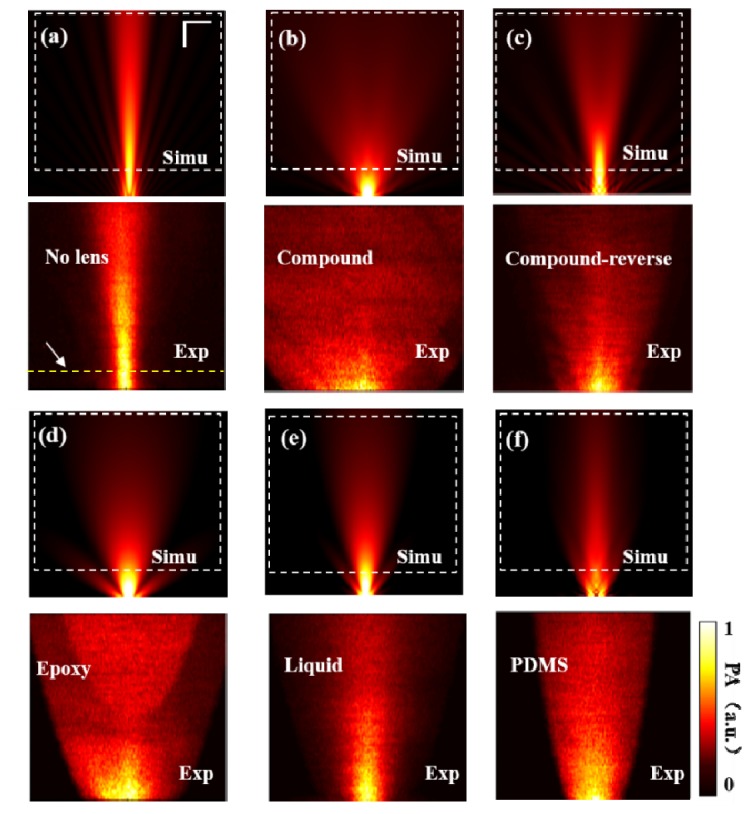
Simulated and experimental acoustic distributions of the transducer without lens (a), and with compound lens (b), compound–reverse lens (c), epoxy lens (d), liquid lens (e) and PDMS lens (f). The dashed rectangles in the simulations represent the corresponding scanned areas in the experiments. Simu: simulated; Exp: experimental. All the images have the same scale bar of 10 mm.
Table 2. Simulated and experimental directivity, measured acoustic pressure and center frequency of the lensed transducers.
| Material | Simulated directivity (°) | Experimental directivity (°) | Acoustic pressure (V) | Center frequency(MHZ) |
|---|---|---|---|---|
| No lens (water) | 14 | 11 | 0.98 | 2.15 |
| Compound | 58 | 55 | 0.6 | 1.9 |
| Compound-reverse | 24 | 22 | 0.48 | 1.9 |
| Epoxy | 30 | 36 | 0.62 | 2.1 |
| Liquid | 25 | 25 | 0.71 | 2 |
| PDMS | 21 | 20 | 0.67 | 2 |
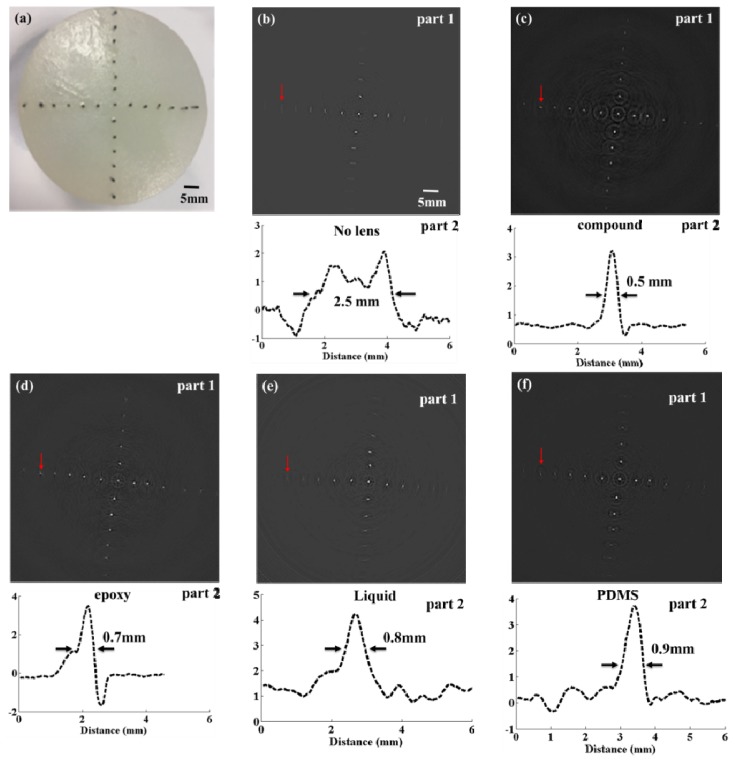
We preformed four phantom experiments to evaluate the performance of the compound lens using a PACT system. Figure 5(a) shows a photo of the phantom with embedded pencil leads. There are two parts in Figs. 5(b–f) in which part 1 is the reconstructed images and part 2 shows the tangential intensity profiles of a selected pencil lead indicated by the red arrows. The FWHMs of the profiles was taken to be the imaged size of the pencil lead. In Fig. 5(b), the imaged size using the flat transducer is 2.5 mm, which is much larger than the actual size of the pencil lead (0.5 mm). When the transducer is equipped with the compound lens, the imaged size is nearly the same as the actual size, as shown in Fig. 5(c). In other cases shown in Figs. 5(d–f), when the single lenses made of epoxy, PDMS, and liquid are used, the imaged sizes are 0.7 mm, 0.8 mm, and 0.9 mm, respectively. Even though the off-center deformation is partially solved by the single lenses, the image quality is still insufficient due to the limited directivity.
Fig. 5.
Photoacoustic images of a pencil lead phantom. (a) The photograph of the phantom with pencil leads embedded. (b-f) Image results and profiles of a selected pencil lead indicated by the red arrows in the cases without using lens (b), and with using the compound lens (c), epoxy lens (d), liquid lens (e) and PDMS lens (f).
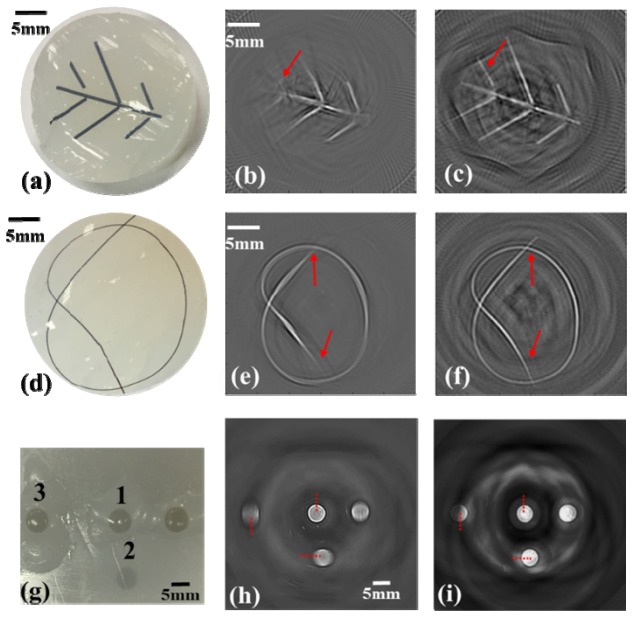
In the first phantom experiment, we demonstrate that the compound lens eliminates the off-center deformation compared to the single lenses. We conducted additional three experiments to show its potential applications and did a detail comparison of the tangential resolutions with and without the compound lens. Figures 6(a) and 6(d) show the photographs of two phantoms which are used to simulate the brain and tumor vasculatures. Compared with the structures in the photographs, many off-center information is missing as indicated by the red arrows in Figs. 6(b) and 6(e). After adding the compound acoustic lens, the imaged structures in Figs. 6(c) and 6(f) agree well with the given structures in the photograph. The last phantom contained four different breast tumor-mimicking targets as shown in Fig. 6(g). The positions of the targets are introduced in the Methods section. The results of the experiments without and with the compound lens are shown in Figs. 6(h) and 6(i), respectively. In Fig. 6(h), all targets except target 1 have deformation induced by the limited directivity of the transducer. This deformation disappears if the compound lens is used. In addition, we note that all the images reconstructed using the data from lensed transducers have unexpected artifacts, while no such artifact is observed in the cases using the flat transducer. There are two major reasons leading to the artifacts: 1) in the reconstruction algorithm, we don’t consider the acoustic differences between the lens materials and the coupling medium; 2) in the cases using the lensed transducers, there are multiple boundaries formed by different materials which can result in reflections of the photoacoustic signals. Although these artifacts always exist once the acoustic lens is introduced, we can solve it by using more complicated model-based reconstruction algorithms with consideration of reflection boundaries and inhomogeneous acoustic velocities.
Fig. 6.
Photographs and photoacoustic images of tumor and vasculature mimicking phantoms. (a, d, g) Photographs of the phantoms. (b, e, h) Photoacoustic images without lens. (e, f, i) Improved photoacoustic images with the compound lens.
We did a quantitative analysis to estimate the tangential resolutions at different locations. Figures 7(a-c) present the edge spread functions (ESFs) of target 1, 2, and 3 indicated by the dashed red line in Figs. 6(g-i). We find that the ESFs of target 2 and 3 with compound lens have steeper edges compared to the case using the flat transducer. We further derived the point spread functions (PSFs) from the ESFs as shown in Figs. 7(d-f) and summarized the tangential resolutions based on the FWHM of the PSFs in Table 3. It is clear that both cases have the same tangential resolution at the central area, and the resolution will deteriorate at the off-center area in the case without using compound lens. However, in the case using the compound lens, we get the same tangential resolution over the entire imaging area.
Fig. 7.

Comparison of the tangential resolutions in the cases with and without the compound lens. (a-c) Edge spread functions (ESF) of target 1, 2, and 3. (d-f) Point spread functions (PSFs) derived from the ESFs in (a-c).
Table 3. Comparison of the tangential resolutions with and without the compound lens.
| Material | FWHM(mm) | ||
|---|---|---|---|
| Target 1 | Target 2 | Target 3 | |
| No lens (water) | 0.4 | 1.2 | 2.5 |
| Compound | 0.4 | 0.4 | 0.4 |
4. Conclusions
In summary, we propose a new compound acoustic lens to improve the directivity of large-area flat transducers in PACT systems. The directivity of a 6-mm flat transducer equipped with the compound lens is much larger than its original directivity. The phantom experiments suggest that this compound lens has the best performance and provides the largest non-deformation imaging area compared to conventional single lenses made of epoxy, PDMS, and liquid. We believe that this development will have an impact on conventional PACT systems, especially on systems used for clinical applications.
Funding
National Natural Science Foundation of China (81571722 and 61528401); State International Collaboration Program from Sichuan (2016HH0019); and startup grant (A03012023601011) from University of Electronic Science and Technology of China.
References and links
- 1.Wang L. V., Hu S., “Photoacoustic tomography: in vivo imaging from organelles to organs,” Science 335(6075), 1458–1462 (2012). 10.1126/science.1216210 [DOI] [PMC free article] [PubMed] [Google Scholar]
- 2.Beard P., “Biomedical photoacoustic imaging,” Interface Focus 1(4), 602–631 (2011). 10.1098/rsfs.2011.0028 [DOI] [PMC free article] [PubMed] [Google Scholar]
- 3.Zhang H. F., Maslov K., Stoica G., Wang L. V., “Functional photoacoustic microscopy for high-resolution and noninvasive in vivo imaging,” Nat. Biotechnol. 24(7), 848–851 (2006). 10.1038/nbt1220 [DOI] [PubMed] [Google Scholar]
- 4.Li M. L., Wang J. C., Schwartz J. A., Gill-Sharp K. L., Stoica G., Wang L. V., “In-vivo photoacoustic microscopy of nanoshell extravasation from solid tumor vasculature,” J. Biomed. Opt. 14(1), 010507 (2009). 10.1117/1.3081556 [DOI] [PMC free article] [PubMed] [Google Scholar]
- 5.Wang L. V., “Multiscale photoacoustic microscopy and computed tomography,” Nat. Photonics 3(9), 503–509 (2009). 10.1038/nphoton.2009.157 [DOI] [PMC free article] [PubMed] [Google Scholar]
- 6.Wang X., Pang Y., Ku G., Xie X., Stoica G., Wang L. V., “Noninvasive laser-induced photoacoustic tomography for structural and functional in vivo imaging of the brain,” Nat. Biotechnol. 21(7), 803–806 (2003). 10.1038/nbt839 [DOI] [PubMed] [Google Scholar]
- 7.Xi L., Zhou L., Jiang H., “C-scan photoacoustic microscopy for in vivo imaging of Drosophila pupae,” Appl. Phys. Lett. 101(1), 013702 (2012). 10.1063/1.4732797 [DOI] [Google Scholar]
- 8.Wang X., Chamberland D. L., Xi G., “Noninvasive reflection mode photoacoustic imaging through infant skull toward imaging of neonatal brains,” J. Neurosci. Methods 168(2), 412–421 (2008). 10.1016/j.jneumeth.2007.11.007 [DOI] [PubMed] [Google Scholar]
- 9.Nie L., Guo Z., Wang L. V., “Photoacoustic tomography of monkey brain using virtual point ultrasonic transducers,” J. Biomed. Opt. 16(7), 076005 (2011). 10.1117/1.3595842 [DOI] [PMC free article] [PubMed] [Google Scholar]
- 10.Huang N., Guo H., Qi W., Zhang Z., Rong J., Yuan Z., Ge W., Jiang H., Xi L., “Whole-body multispectral photoacoustic imaging of adult zebrafish,” Biomed. Opt. Express 7(9), 3543–3550 (2016). 10.1364/BOE.7.003543 [DOI] [PMC free article] [PubMed] [Google Scholar]
- 11.Ermilov S. A., Khamapirad T., Conjusteau A., Leonard M. H., Lacewell R., Mehta K., Miller T., Oraevsky A. A., “Laser optoacoustic imaging system for detection of breast cancer,” J. Biomed. Opt. 14(2), 024007 (2009). 10.1117/1.3086616 [DOI] [PubMed] [Google Scholar]
- 12.Pramanik M., Ku G., Wang L. V., “Tangential resolution improvement in thermoacoustic and photoacoustic tomography using a negative acoustic lens,” J. Biomed. Opt. 14(2), 024028 (2009). 10.1117/1.3103778 [DOI] [PMC free article] [PubMed] [Google Scholar]
- 13.Drozdov G., Rosenthal A., “Analysis of Negative focused ultrasound detectors in optoacoustic tomography,” IEEE Trans. Med. Imaging 36(1), 301–309 (2017). 10.1109/TMI.2016.2606482 [DOI] [PubMed] [Google Scholar]
- 14.Pierce A. D., Beyer R. T., “Acoustics: An Introduction to Its Physical Principles and Applications,” J. Acoust. Soc. Am. 87(4), 1826–1827 (1990). 10.1121/1.399390 [DOI] [Google Scholar]
- 15.Xia W., Piras D., Heijblom M., Van Hespen J. C. G., Veldhoven S. V., Prins C., Steenbergen W., Leeuwen T. G. V., Manohar S., “Enlarged acceptance angle of a finite size detector in photoacoustic imaging using acoustic lenses,” European Conferences on Biomedical Optics, International Society for Optics and Photonics, 8090(3), 298–306 (2011). [Google Scholar]
- 16.He Y., Tang Z., Chen Z., Wan W., Li J., “A novel photoacoustic tomography based on a time-resolved technique and an acoustic lens imaging system,” Phys. Med. Biol. 51(10), 2671–2680 (2006). 10.1088/0031-9155/51/10/019 [DOI] [PubMed] [Google Scholar]
- 17.Pilatou M., Voogd N., Mul F., Steenbergen W., Adrichem L., “Analysis of three-dimensional photoacoustic imaging of a vascular tree in vitro,” Rev. Sci. Instrum. 74(10), 4495–4499 (2003). 10.1063/1.1605491 [DOI] [Google Scholar]
- 18.Abdulhalim I., Pannell C. N., “Acousto-optic in-Fibre Modulator using Acoustic Focusing,” IEEE Photonics Technol. Lett. 5(9), 999–1002 (1993). 10.1109/68.257171 [DOI] [Google Scholar]
- 19.Pannell C. N., Wacogne B. F., Abdulhalim I., “In-Fiber and Fiber-Compatible Acoustooptic Components,” J. Lightwave Technol. 13(7), 1429–1434 (1995). 10.1109/50.400708 [DOI] [Google Scholar]
- 20.Li C., Ku G., Wang L. V., “Negative lens concept for photoacoustic tomography,” Phys. Rev. E Stat. Nonlin. Soft Matter Phys. 78(2), 021901 (2008). 10.1103/PhysRevE.78.021901 [DOI] [PMC free article] [PubMed] [Google Scholar]
- 21.Xia W., Piras D., van Hespen J. C., Steenbergen W., Manohar S., “A new acoustic lens material for large area detectors in photoacoustic breast tomography,” Photoacoustics 1(2), 9–18 (2013). 10.1016/j.pacs.2013.05.001 [DOI] [PMC free article] [PubMed] [Google Scholar]
- 22.Chang C., Firouzi K., Park K. K., Sarioglu A., Nikoozadeh A., Toon H., Vaithilingam S., Carver T., Khuri-Yakub B., “Acoustic lens for capacitive micromachined ultrasonic transducers,” J. Micromech. Microeng. 24(8), 085007 (2014). 10.1088/0960-1317/24/8/085007 [DOI] [PMC free article] [PubMed] [Google Scholar]
- 23.Song C., Xi L., Jiang H., “Liquid acoustic lens for photoacoustic tomography,” Opt. Lett. 38(15), 2930–2933 (2013). 10.1364/OL.38.002930 [DOI] [PubMed] [Google Scholar]
- 24.Xi L., Song C., Jiang H., “Confocal photoacoustic microscopy using a single multifunctional lens,” Opt. Lett. 39(11), 3328–3331 (2014). 10.1364/OL.39.003328 [DOI] [PubMed] [Google Scholar]
- 25.Hoelen C. G. A., de Mul F. F. M., “Image reconstruction for photoacoustic scanning of tissue structures,” Appl. Opt. 39(31), 5872–5883 (2000). 10.1364/AO.39.005872 [DOI] [PubMed] [Google Scholar]


