
Fig. 4.
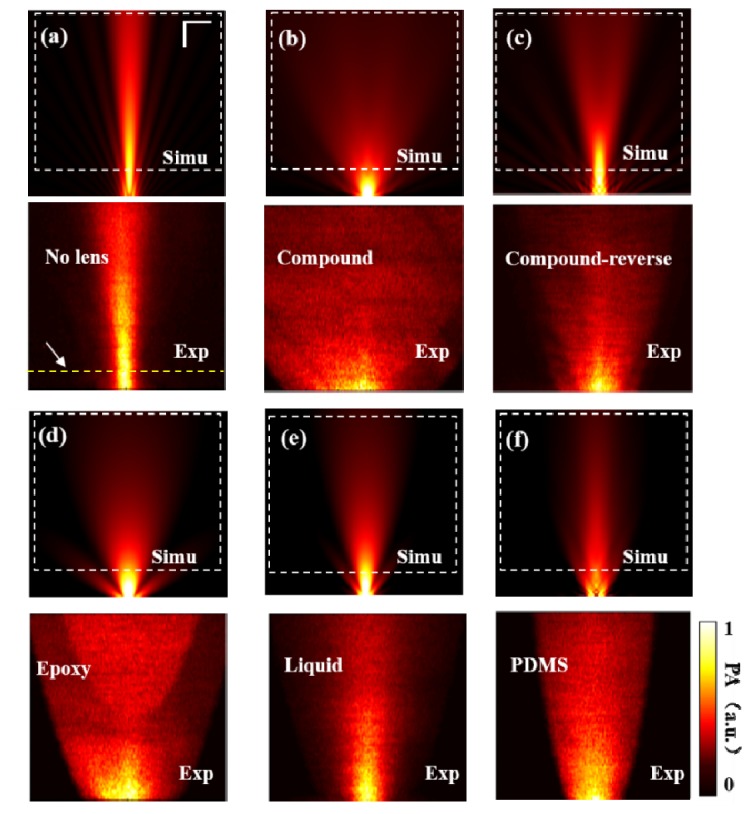
Simulated and experimental acoustic distributions of the transducer without lens (a), and with compound lens (b), compound–reverse lens (c), epoxy lens (d), liquid lens (e) and PDMS lens (f). The dashed rectangles in the simulations represent the corresponding scanned areas in the experiments. Simu: simulated; Exp: experimental. All the images have the same scale bar of 10 mm.