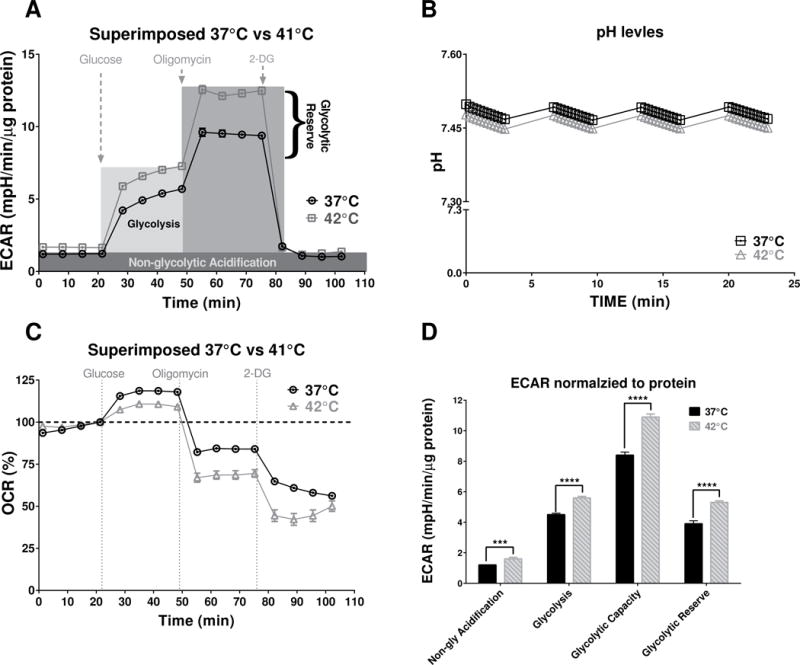
Figure 5. Glycolysis stress test for SW480 cell at normal and high temperatures.

(A) SW480 ECAR profile components presented over the experimental record from 42°C vs. 37°C. (B) There was no statistically difference in pH levels in background wells during the measurement of the baseline ECAR signals. (C) The percent change of oxygen consumption rates during the glycolysis stress test indicated that after adding 10μM Glucose the cells at 37°C consumed more oxygen compare to the cells at 42°C. (D) The unpaired t-test with Welch’s correction of ECAR signal components suggests that all aspects of glycolysis were significantly increased at the higher temperature: Non-glycolytic Acidification (P=0.0002, n=69–77); Glycolysis (P<0.0001, n=69–77); Glycolytic Capacity (P<0.0001, n=69–77) and Glycolytic Reserve (P<0.0001, n=69–77).
