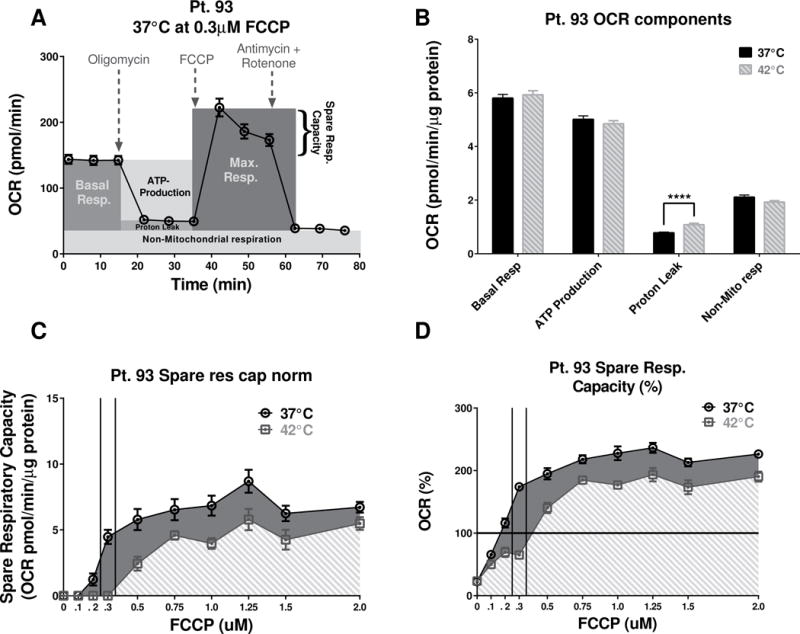
Figure 6. Mitochondria stress test for Pt. 93 at normal and high temperatures and FCCP dose response.

(A) The “raw” (not normalized to protein) 37°C Pt. 93 OCR profile at 0.3 μM FCCP was used to illustrate the various components of the Pt. 93 mitochondrial function. (B) Quantification of the temperature difference in Pt. 93 OCR components that are independent of FCCP concentrations. Proton leak was significantly increased (P<0.0001, unpaired t-test with Welch’s correction, n=65–66) at the higher temperature, while all other components remained without significant changes. (C) The changes in the SRC, due to various FCCP doses at 37°C, were more prominent (unlike the SW480) compared to the 42°C. (AUC analysis shows a 39% increase of the “overall” respiratory capacity at 37°C vs the 42°C condition.) (D) The analysis of AUC for the %SRC was limited to the baseline, and at 42°C the cells had ~40% lower “overall” metabolic potential.
