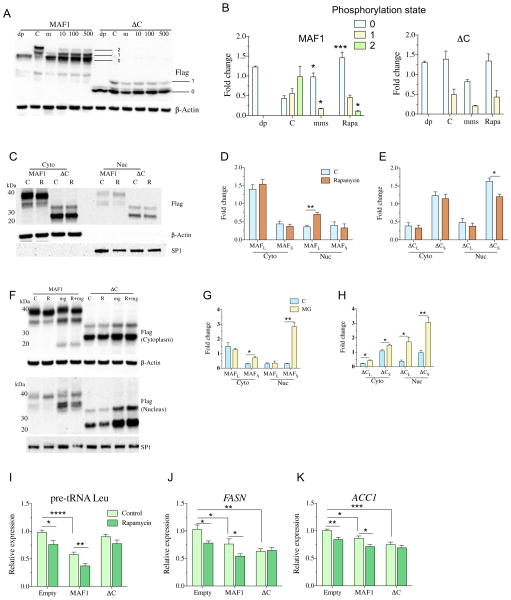
Fig. 4.
C-box regulates rapamycin response and stability of MAF1L. (A and B) Western blot of Phos-tag® gel showing phosphorylated and dephosphorylated bands following treatment with (C) DMSO, 0.03% MMS (m), and 10, 100, and 500 nM of rapamycin for 3 h in HEK293T cells. For dephosphorylated band analysis, untreated cells were lysed, and phosphatase treatment was performed for 30 min (dp). Bands were quantified in (B), where each treated band is normalized to β-Actin levels. The numbers indicate 0 = smallest band, 1 = middle band, and 2 = topmost band. Data represent mean ± SEM from three independent experiments. Student’s t-test was performed for each band in the treated group to their respective band in the control group, * p < 0.05, *** p < 0.001. dp = phosphatase treated, m = 0.03% MMS, 10 = 10 nM rapamycin, 100 = 100 nM rapamycin, 500 = 500 nM rapamycin, C = DMSO control. (C–E) Western blot of MAF1 and ΔC cytoplasmic and nuclear fractions after (C) 3 h of treatment with 10 nM rapamycin in HEK293T cells, and (D) quantification of MAF1L and MAF1S and (E) ΔCL and ΔCS bands using β-Actin as a normalizing control for cytoplasmic fractions while SP1 for nuclear fractions. Data represent mean ± SEM from four independent experiments. Student’s t-test, * p < 0.05, ** p < 0.01. R = 10 nM rapamycin, C = DMSO control. (F–H) Western blot of MAF1 and ΔC cytoplasmic and nuclear fractions following (F) 3 h of treatment with 10 nM rapamycin and 10 μM MG-132 in HEK293T cells and quantified for (G) MAF1L and MAF1S and (H) ΔCL and ΔCS. Data represent mean ± SEM from three independent experiments. Student’s t-test, * p < 0.05, ** p < 0.01. R = 10 nM rapamycin, mg = 10 μM MG132, R + mg = 10 nM rapamycin and 10 μM MG-132 treatment, C = DMSO control. (I–K) qPCR analysis of pol III and pol II targets following 6-h exposure of 10 nM rapamycin in HEK-293T cells. Data represent mean ± SEM from three independent experiments, n = 12. Student’s t-test was performed to determine statistical significance between the control and the respective rapamycin-treated group, while ANOVA followed by Dunnett’s post-test was used for multivariable analysis.

