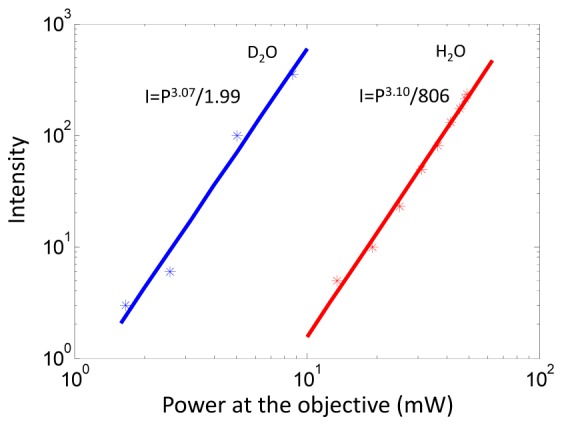
Fig. 4.

Logarithmic plots of intensity and excitation power at the objective indicating three-photon excitation. A first order polynomial fit is applied to a log-log plot of the data, as shown by the solid curves. The results for using heavy water (D2O) and regular water (H2O) as the immersion medium are indicted by blue and red data points, respectively.
