Fig. 5.
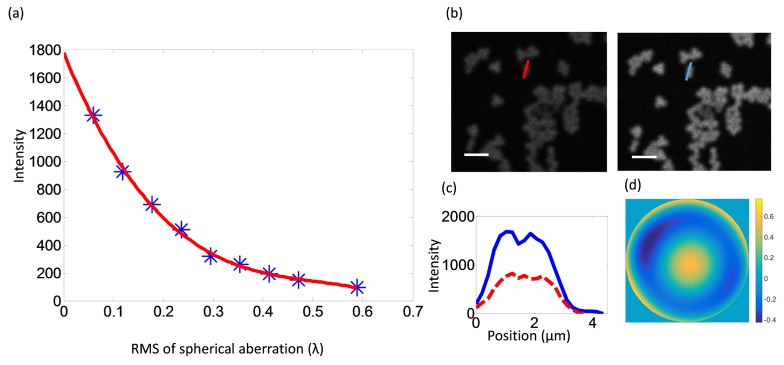
3P-AO imaging of fluorescent microspheres. (a) Fluorescence intensity decreases as spherical aberration increases. Red line: cubic curve fitting. (b) Images of microspheres before and after AO correction, where the aberration was introduced by adjusting the correction collar of the objective lens. (c) The intensity profiles along the lines in (b). (d) The final phase on the DM. Scale bar, 5 µm.

