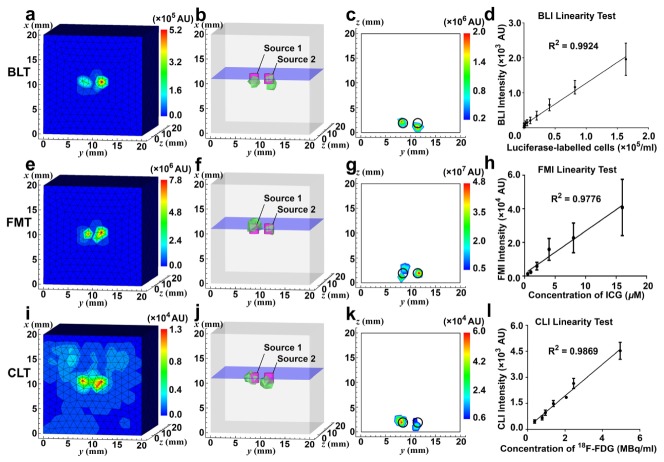
Fig. 5.
Results of performance tests of optical tomographies. (a, e, i) CCD counts of acquired BLI, FMI, and CLI image in arbitrary units (AU) were mapped on the cubic phantom, respectively. (b, f, j) BLT/FMT/CLT reconstruction of the two sources in the phantom, respectively. Reconstructed signals above 10% of the maximum reconstructed power is delineated with bounding green polyhedrons. Magenta cylinders center at the positions of the actual sources. (c, g, k) The slice taken from x = 11 mm, i.e. the blue plane in (b, f, j) respectively, shows reconstructed power intensity distribution in AU and displacement from actual sources. Positions of the actual sources are indicated by black circles. (d, h, l) The result of linearity tests of BLI, FMI, and CLI, respectively.

