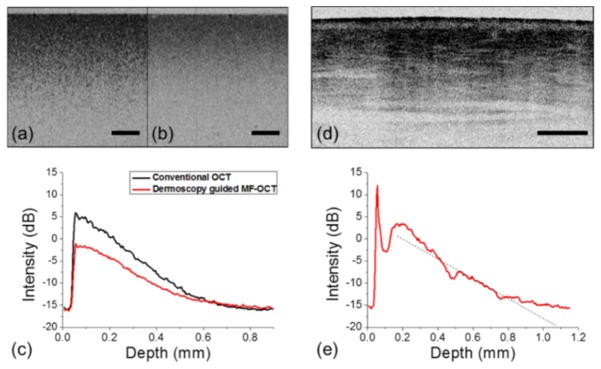
Fig. 3.
Comparison between dermoscopy guided MF-OCT and conventional OCT in a tissue phantom and sensitivity analysis of dermoscopy guided MF-OCT in the human skin. (a, b) Cross-sectional intensity OCT images of a TiO2 tissue phantom by dermoscopy guided MF-OCT and conventional OCT respectively. (c) Mean intensity profiles with depth of the two intensity OCT images in (a) and (b). (d) Cross-sectional intensity OCT image of the dorsum of human hand by dermoscopy guided MF-OCT. (e) Mean intensity profile with depth of the intensity OCT image in (d). All scale bars are 500 μm.

