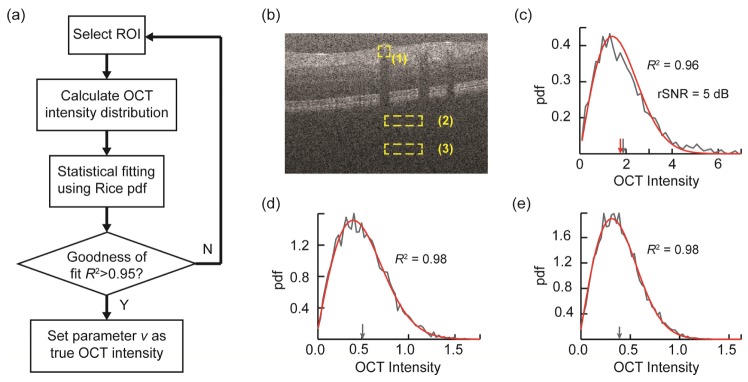
Fig. 2.
(a) Flowchart showing the steps of retrieving true OCT intensity using statistical fitting approach. For OCT oximetry, the same ROI is used for all narrow-band images. (b) A typical human vis-OCT B-scan image showing three sampling regions: one from within a blood vessel (1) and two from the background at different depths (2) and (3). (c) The pdf of OCT intensity (gray line) from box (1) and its statistical fitting (red line). The gray and red arrows indicate the arithmetic mean and fitted OCT intensity, respectively. (d) and (e) The pdfs of pure OCT noise intensities from the background at their respective depths in gray lines (boxes 2 and 3). Red lines are the corresponding statistical fittings. The gray arrows indicate arithmetic means. The fitted OCT intensities were both approximately zero.

