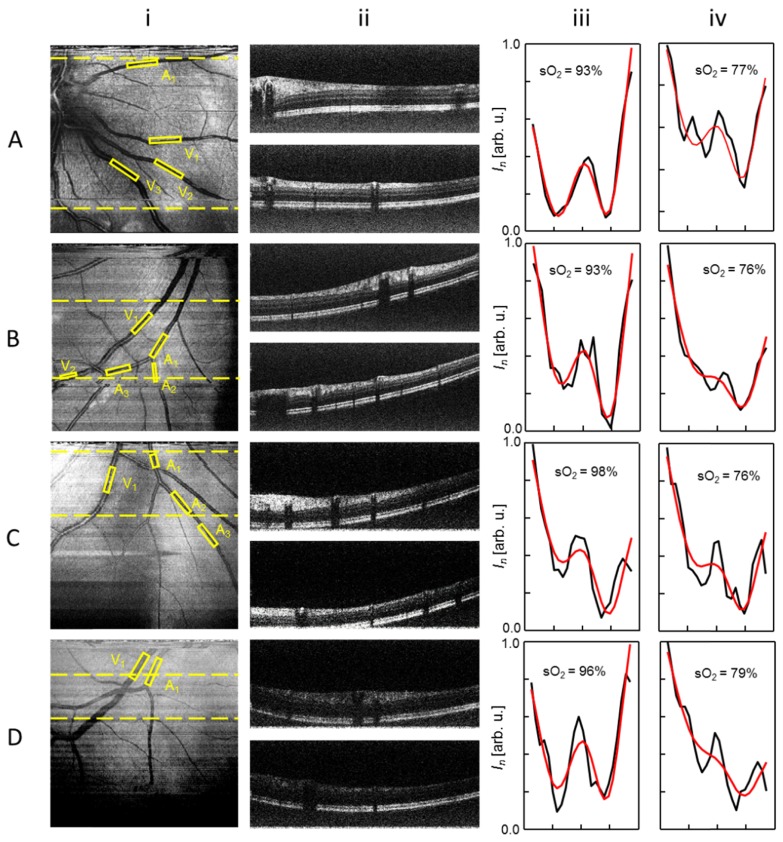
Fig. 4.
Vis-OCT imaging results with different rSNRs from four healthy volunteers (A to D). Column i: vis-OCT en face fundus images. Column ii: vis-OCT B-scan images from the corresponding locations highlighted by the dashed lines in column i. Column iii: OCT intensity spectrum taken from the identified central retinal arteries (A1, black curve) and their corresponding least-squares fitted results (red line). Column iv: OCT intensity spectrum taken from the identified central retinal veins (V1, black curve) and their corresponding least-squares fitted results (red line).

